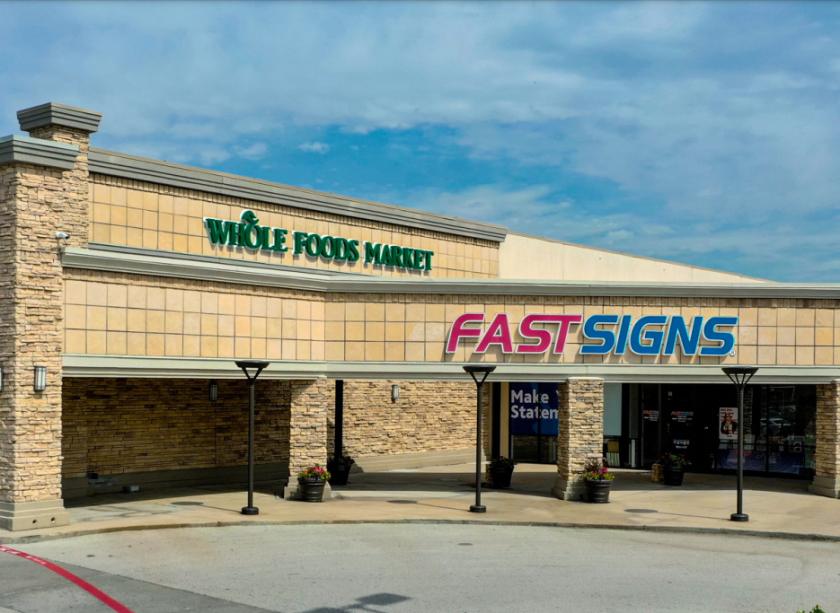
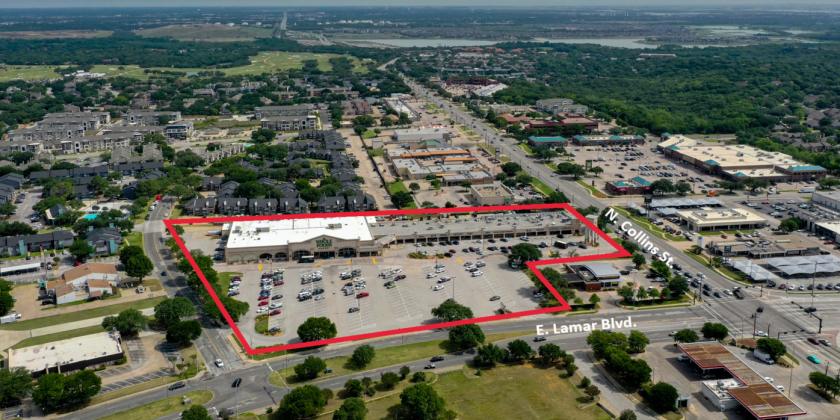
1-Mile | 3-Miles | 5-Miles | ||
---|---|---|---|---|
Total Population | 17,317 | 88,415 | 270,423 | |
Population Median Age | 33 | 34 | 34 | |
Population by Age | 0-9 Yrs | 2318 (13%) | 11274 (12%) | 39588 (14%) |
10-19 Yrs | 1280 (7%) | 11551 (13%) | 36053 (13%) | |
20-29 Yrs | 5011 (28%) | 19441 (21%) | 49923 (18%) | |
30-39 Yrs | 3252 (18%) | 12820 (14%) | 39894 (14%) | |
40-49 Yrs | 1726 (9%) | 10708 (12%) | 34740 (12%) | |
50-59 Yrs | 1602 (9%) | 10001 (11%) | 30230 (11%) | |
60-69 Yrs | 1377 (7%) | 7106 (8%) | 21821 (8%) | |
70+ Yrs | 751 (4%) | 5515 (6%) | 18174 (6%) | |
Median HH Income | $49,566 | $51,276 | $53,516 | |
Total Household Income | < 24K | 1464 (16%) | 7302 (20%) | 19669 (19%) |
25-49K | 2944 (33%) | 10274 (28%) | 28160 (27%) | |
50-74K | 2206 (25%) | 7114 (19%) | 20007 (19%) | |
75-99K | 970 (11%) | 3856 (10%) | 12358 (12%) | |
100-199K | 904 (10%) | 5516 (15%) | 17485 (17%) | |
200K+ | 243 (2%) | 1883 (5%) | 4115 (4%) | |
Highest Education Level | No Diploma | 901 | 7608 | 29287 |
Diploma or GED | 2155 | 12630 | 41654 | |
Some College | 3579 | 13931 | 39770 | |
Assoc. Degree | 1380 | 4613 | 12785 | |
Bachelors Degree | 2806 | 11667 | 32335 | |
Higher Degree | 1375 | 7082 | 16426 | |
Total Housing Units | 10,203 | 40,577 | 113,669 | |
--Owner-Occupied | 1,741 | 12,283 | 39,520 | |
--Renter-Occupied | 6,990 | 23,662 | 62,275 | |
Owner-Occupied Values | < 100K | 367 | 2061 | 7040 |
100-199K | 514 | 3775 | 15759 | |
200-299K | 432 | 3619 | 11182 | |
300-399K | 315 | 1712 | 3488 | |
400-499K | 70 | 692 | 1391 | |
500K+ | 43 | 424 | 660 | |
Total Working Age Population | 14,148 | 70,934 | 209,499 | |
In Work Force | 11,223 | 50,645 | 147,817 | |
Not In Work Force | 2,925 | 20,289 | 61,682 | |
Workforce Employed | 10,573 | 47,848 | 139,933 | |
Workforce Unemployed | 645 | 2,721 | 7,718 | |
Civlian Workforce | 11,218 | 50,569 | 147,650 | |
Military Workforce | 5 | 76 | 167 | |
Total Households | 8,731 | 35,945 | 101,795 | |
Family Households | 3,707 | 19,419 | 61,955 | |
Non-Family Households | 5,024 | 16,526 | 39,840 | |
Married Couple | 2,212 | 12,632 | 40,152 | |
Other Family | 1,494 | 6,787 | 21,803 | |
Married w/Child | 984 | 5,279 | 17,466 | |
Single Male w/Child | 141 | 798 | 2,587 | |
Single Female w/Child | 833 | 3,099 | 9,490 |
Population Change Last Two Decades - Plus Projection
2000 | % | 2010 | % | 2020 | % | 2030 | |
---|---|---|---|---|---|---|---|
Texas | 20,851,820 | +21 | 25,145,561 | +18 | 29,677,668 | +18 | 34,894,452 |
Tarrant County | 1,446,219 | +25 | 1,809,034 | +19 | 2,143,755 | +17 | 2,507,170 |
Dallas County | 2,218,899 | +7 | 2,368,139 | +15 | 2,734,111 | +14 | 3,106,298 |
Total Working Age Population:
Total Households:
Total Working Age Population:
Total Households:
Total Working Age Population:
Total Households: