Office Space
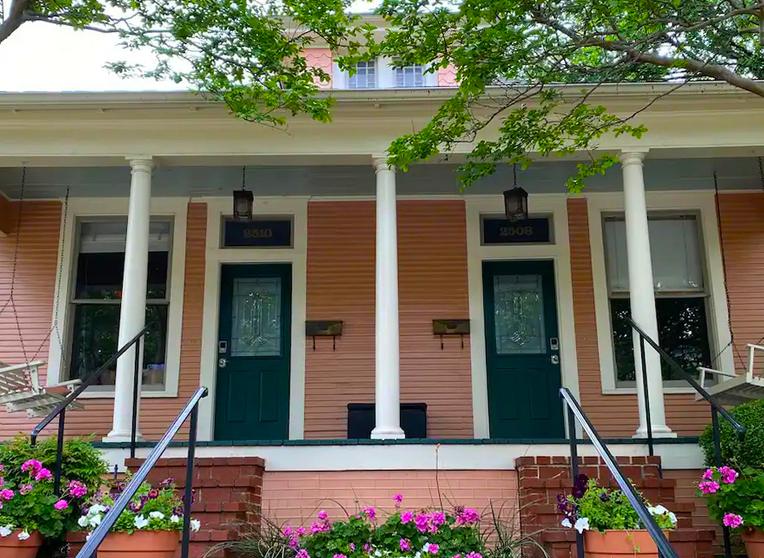
2508 and 2510 Boll St Dallas, TX 75204
2508 and 2510 Boll St Dallas, TX 75204
Details & Description
Property Highlights
• The suites can be leased together or separately. Unique opportunity to live on one side and office on the other side
• Perfect for a Law Firm, Real Estate company, CPA, or Private Equity group. Up to 12 street parking permits available
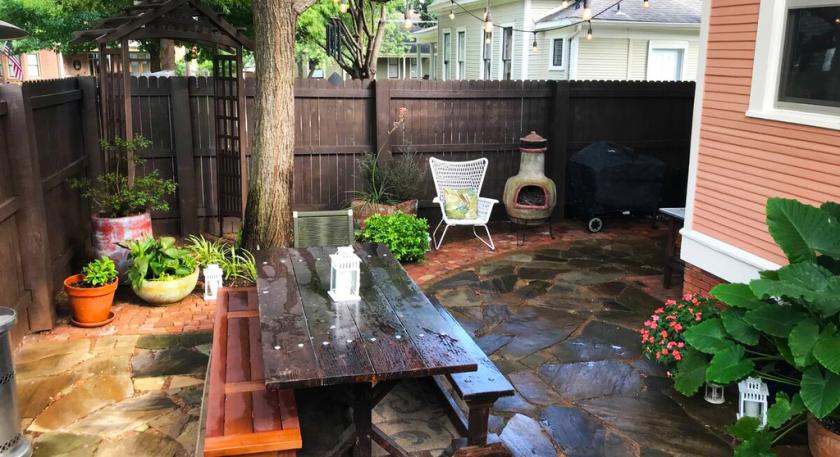
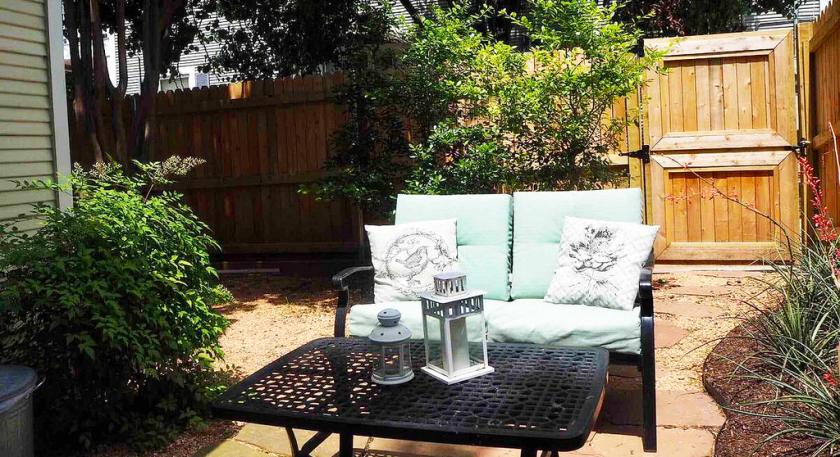
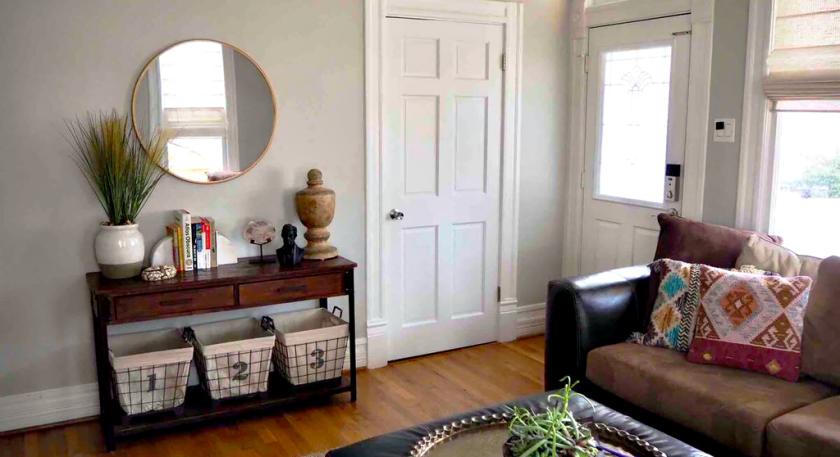
Additional Photos
Listing Agents

Jared Laake
O: 972-776-7045
jlaake@bradford.com
O: 972-776-7045
jlaake@bradford.com
While we strive to provide the most accurate information, all listing information, and demographic data, is provided by third-parties. As such, MyEListing will not be responsible for the accuracy of the information. It is strongly recommended that you verify all information with the listing agent, and any relevant agencies, prior to making any decisions.


