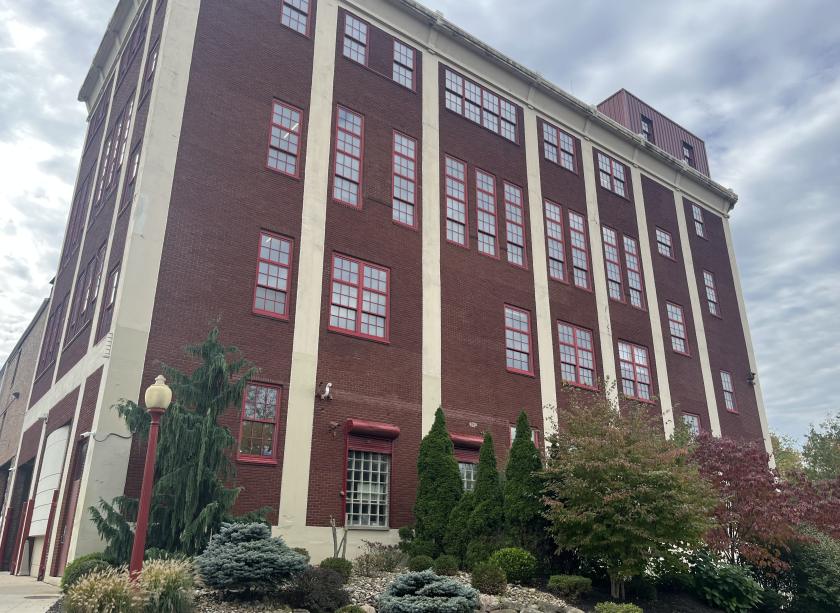
Office Space
190 North Union Street Akron, OH 44304
190 North Union Street Akron, OH 44304
Details & Description
Property Highlights
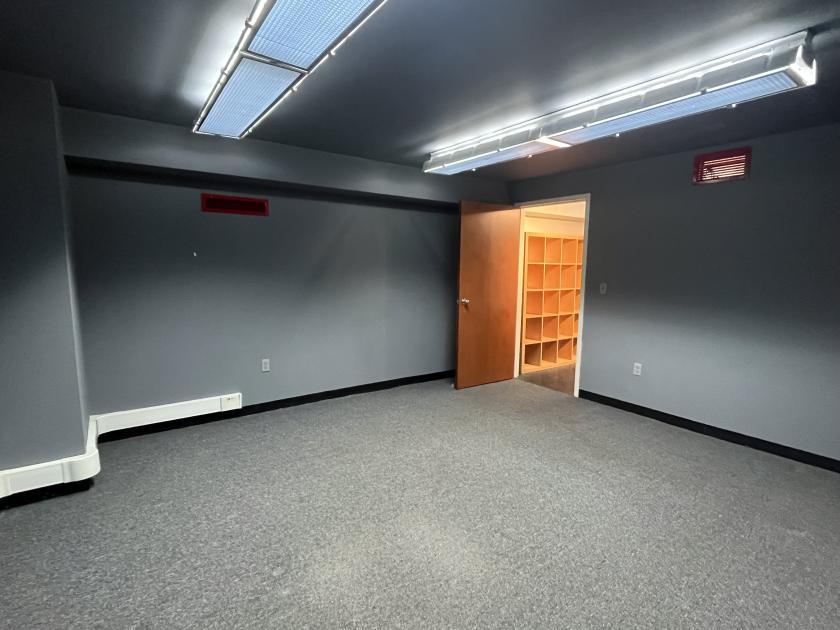
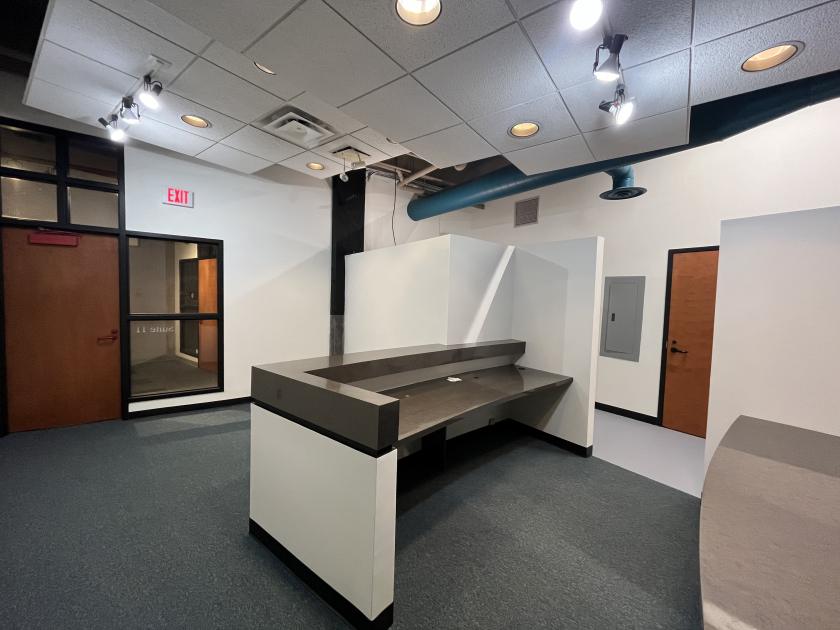
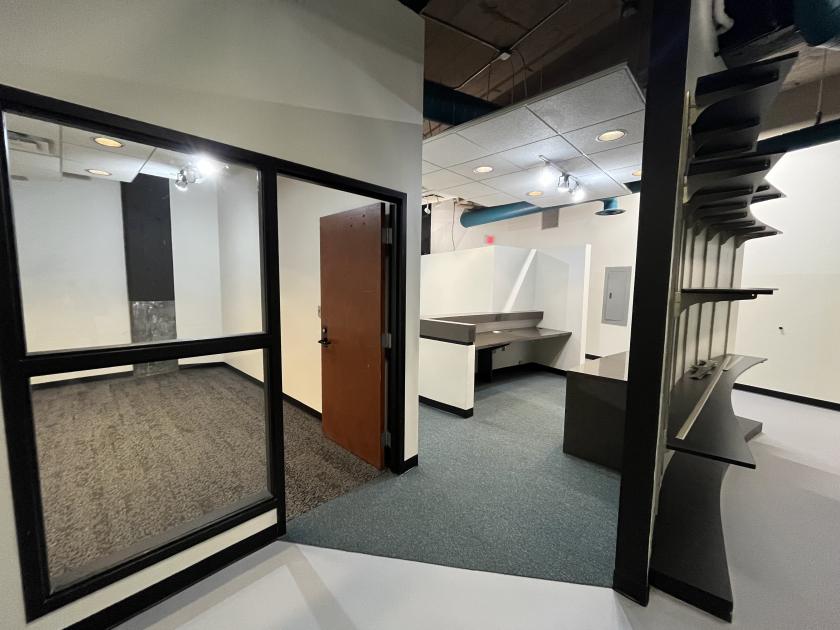
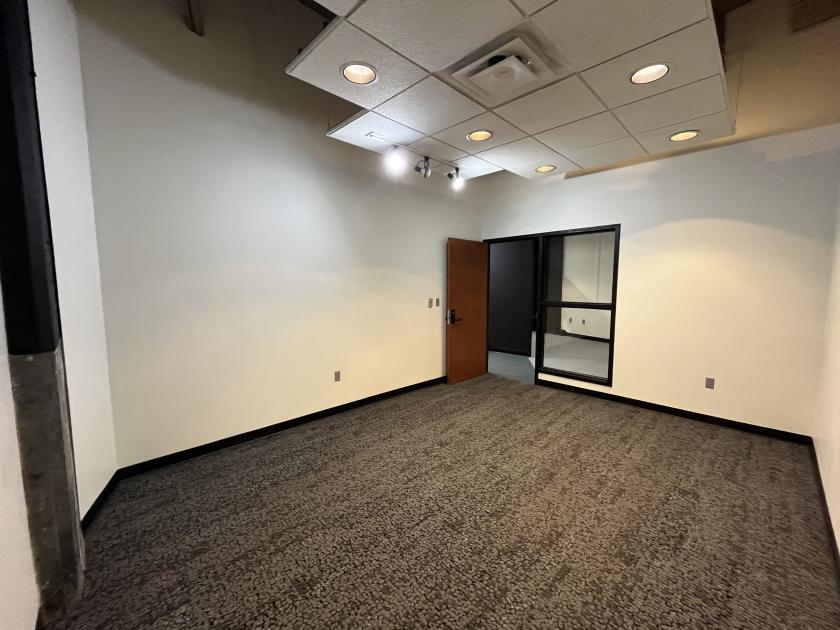
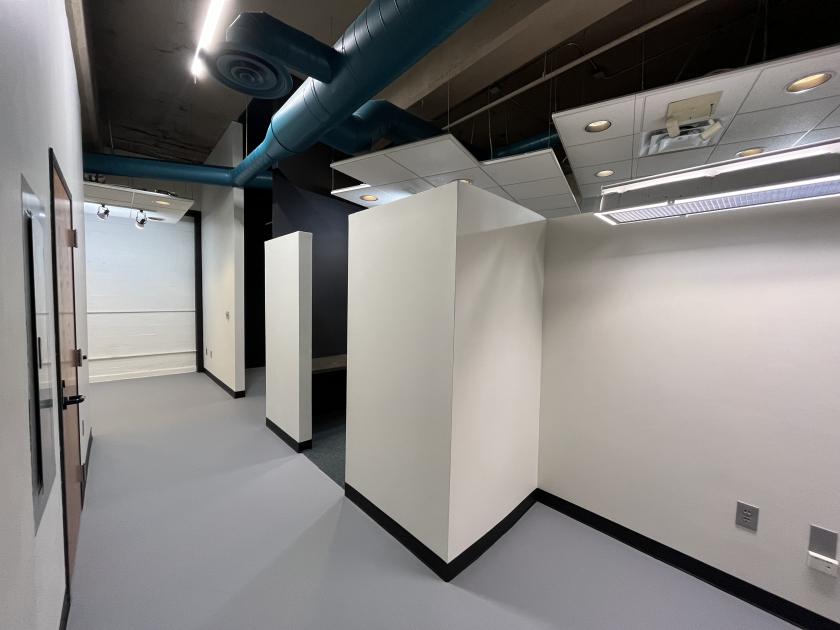
• Suite 11 Available - 1,155 SF: Former office & storage for a stage production company
• Suite 10 Available - 4,310 SF: Former videography studio
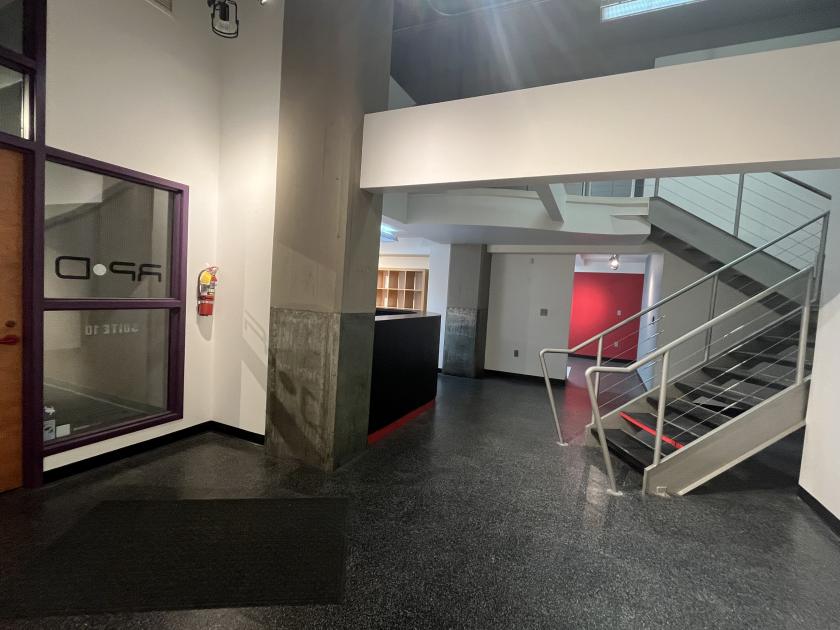
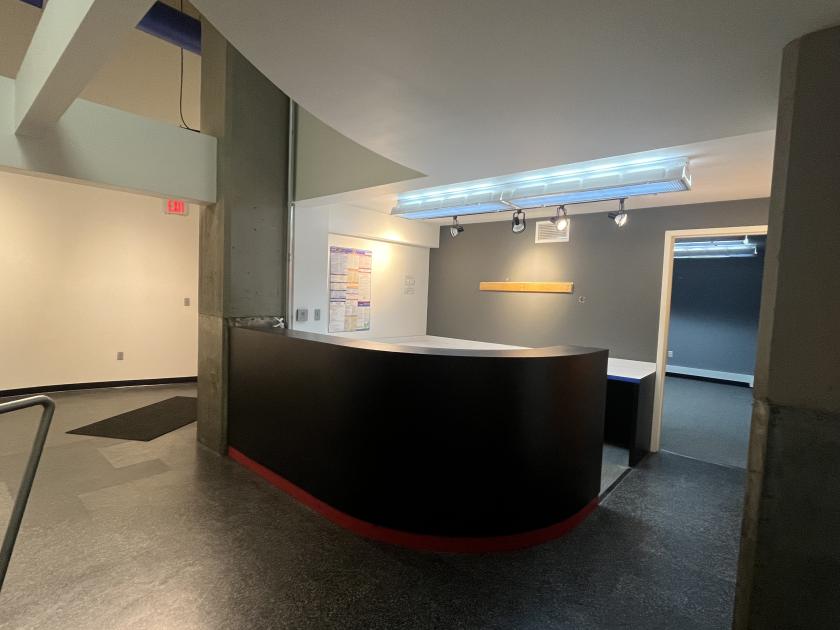
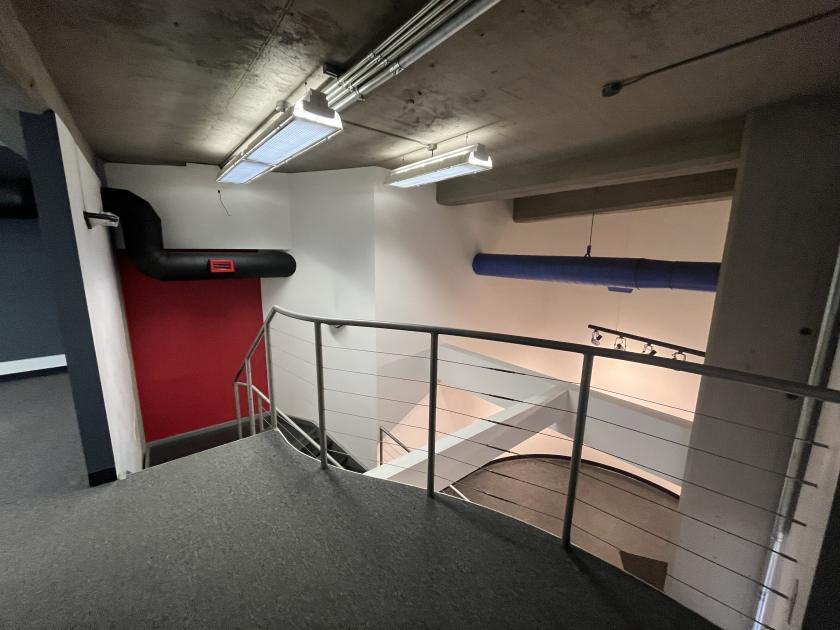
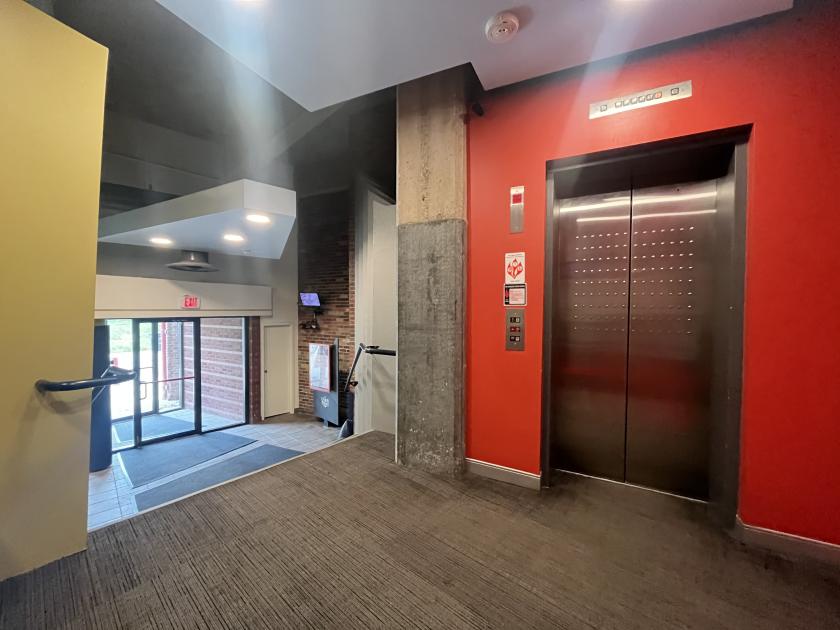
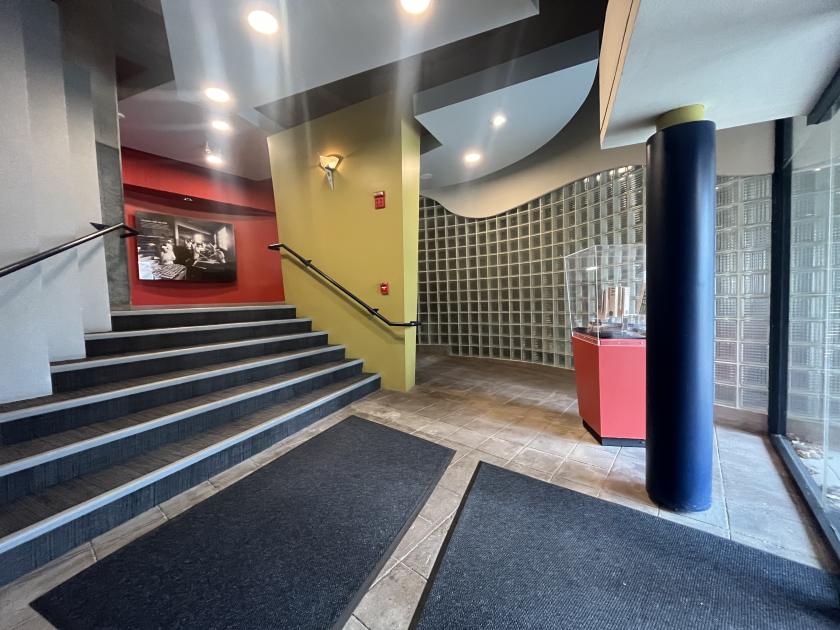
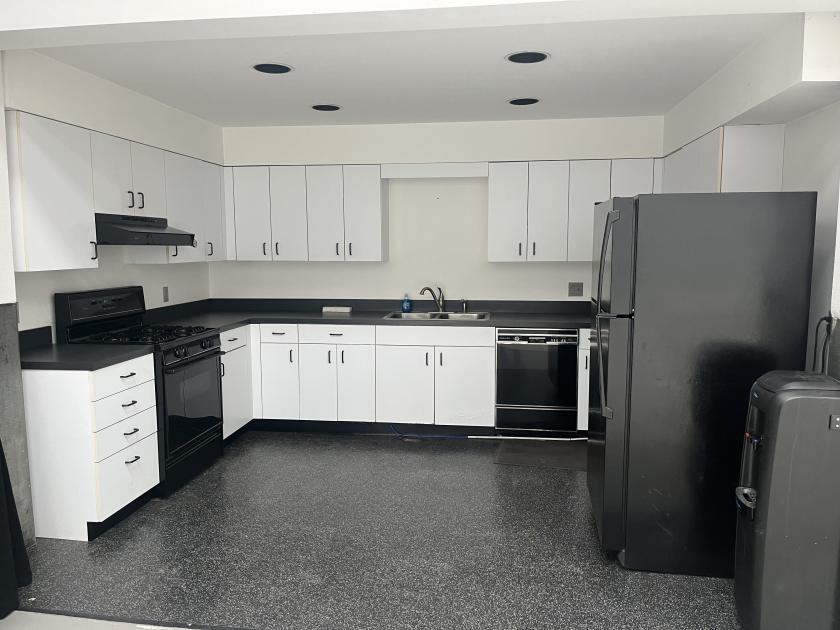
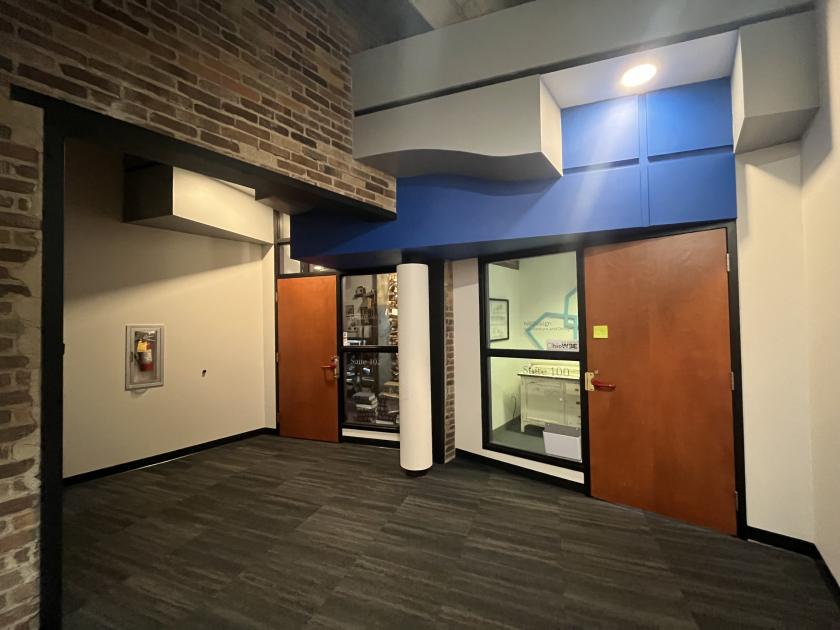
Additional Photos
Listing Agents

Marissa Rufe
M: 330-204-3873
marissa.rufe@naipvc.com
M: 330-204-3873
marissa.rufe@naipvc.com
While we strive to provide the most accurate information, all listing information, and demographic data, is provided by third-parties. As such, MyEListing will not be responsible for the accuracy of the information. It is strongly recommended that you verify all information with the listing agent, and any relevant agencies, prior to making any decisions.