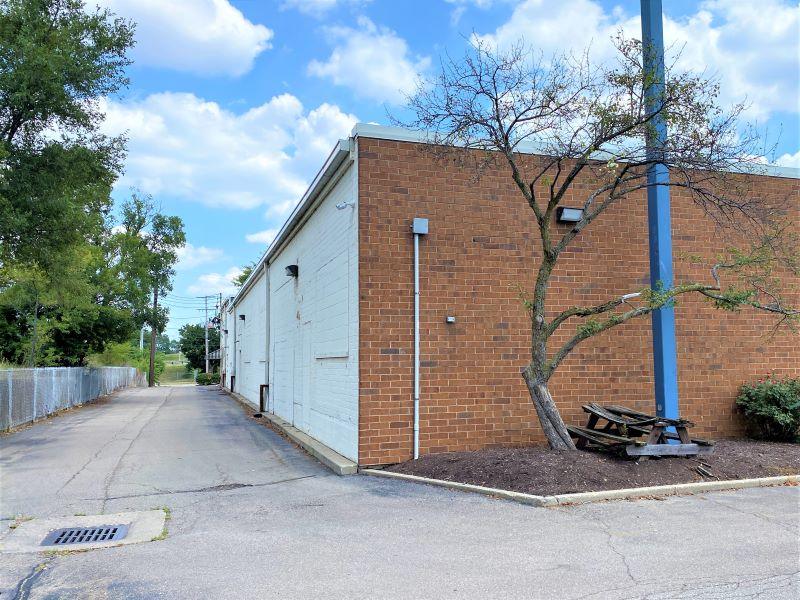
Office Space
725 South Ludlow Street Dayton, OH 45402
725 South Ludlow Street Dayton, OH 45402
Details & Description
Property Highlights
- • Excellent location is visible from US35.
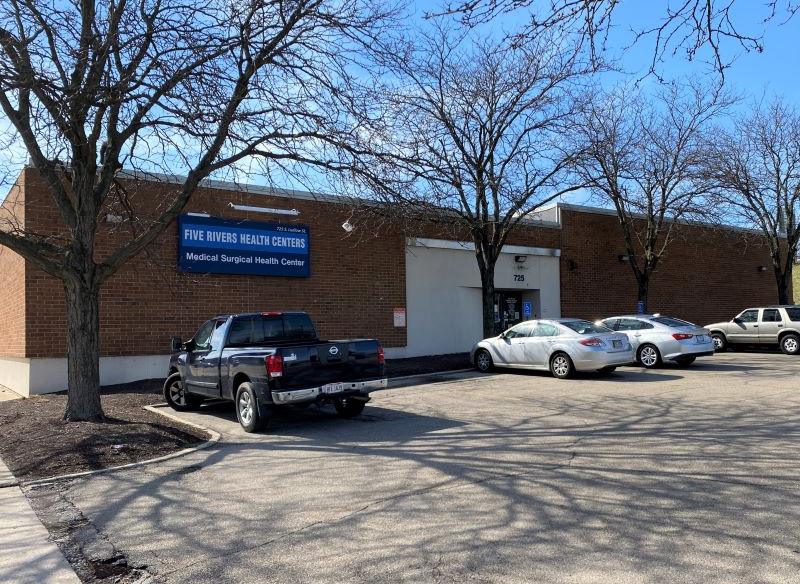
- • Located in the downtown Central Business District.
- • Convenient parking in front of the building.
- • Large lot in the rear of the building.
- • Located on a bus line.
- • Ceiling Height is 13 feet 7 inches.
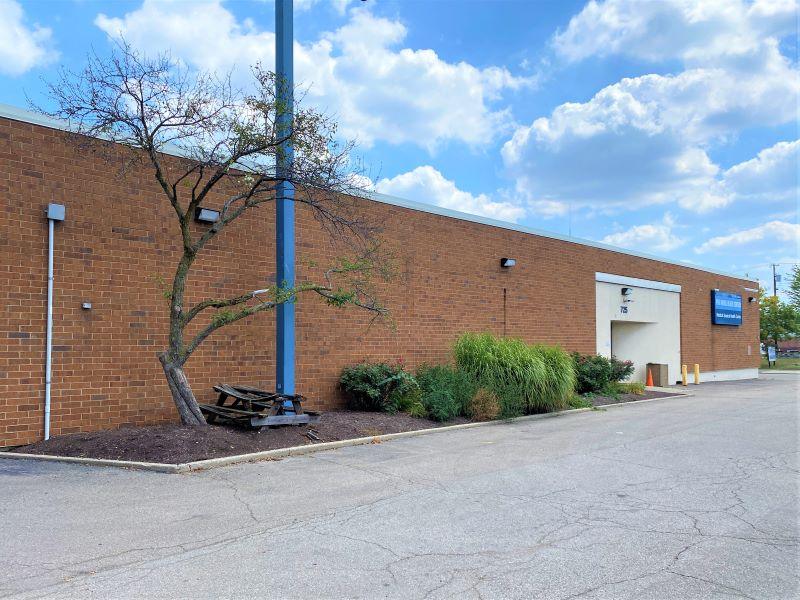
Additional Photos


Listing Agents

Tracy Rutherford
O: 937-222-1600
M: 937-414-2271
trutherford@crestrealtyohio.com
O: 937-222-1600
M: 937-414-2271
trutherford@crestrealtyohio.com
While we strive to provide the most accurate information, all listing information, and demographic data, is provided by third-parties. As such, MyEListing will not be responsible for the accuracy of the information. It is strongly recommended that you verify all information with the listing agent, and any relevant agencies, prior to making any decisions.