Office Space
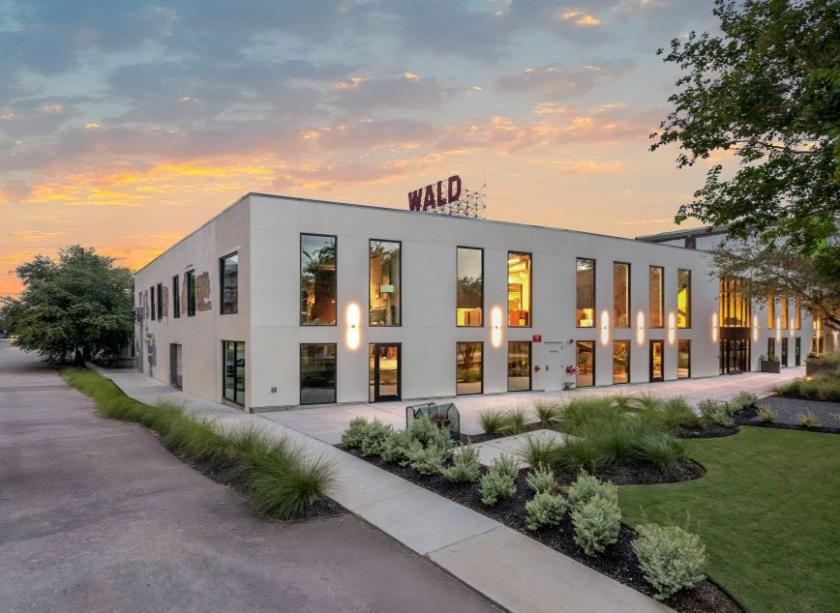
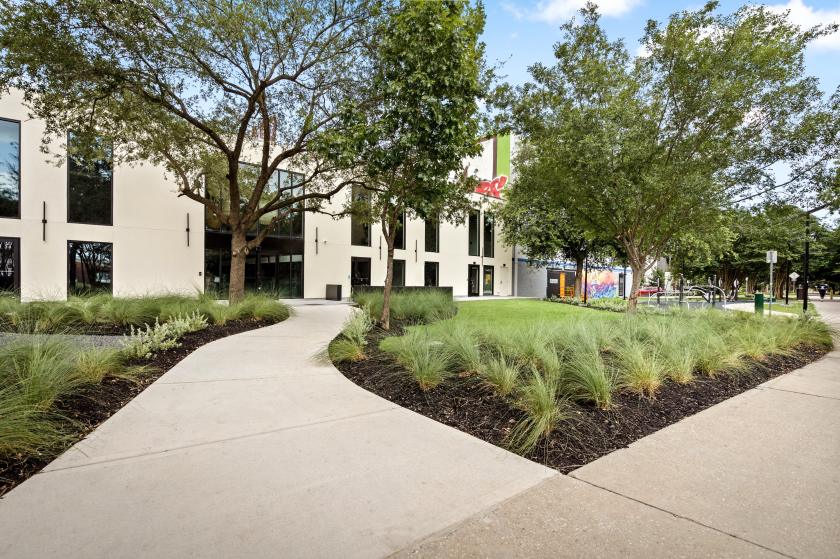
815 Saint Charles Street Houston, TX 77003
815 Saint Charles Street Houston, TX 77003
Details & Description
Property Highlights
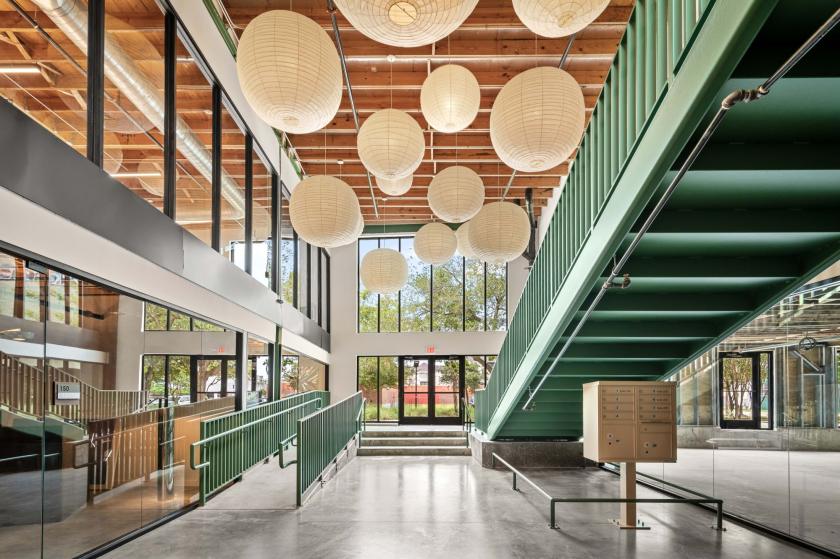
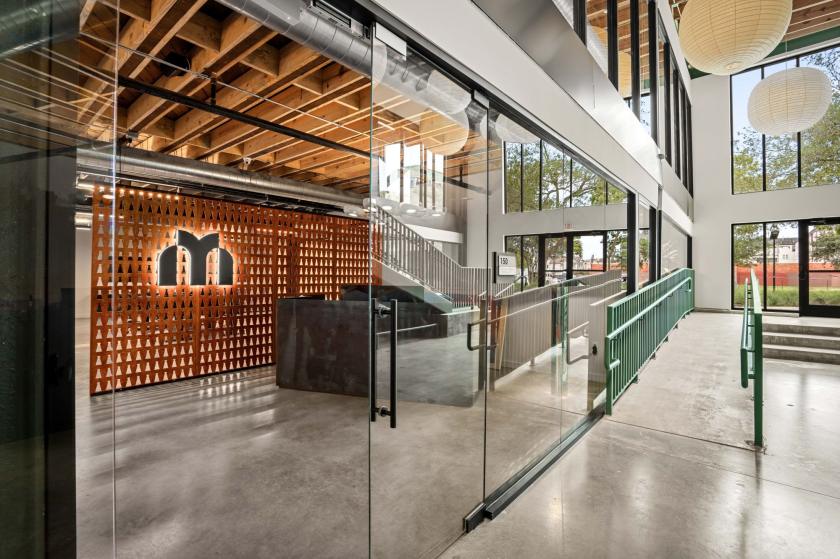
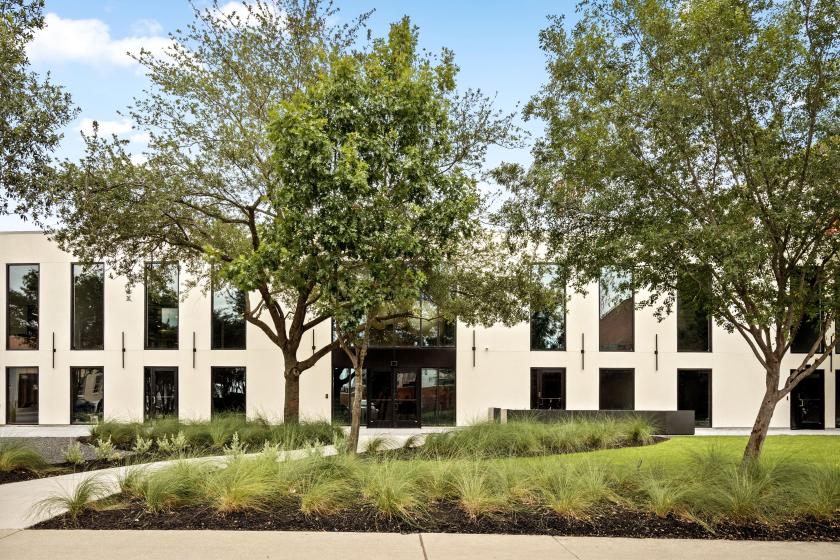
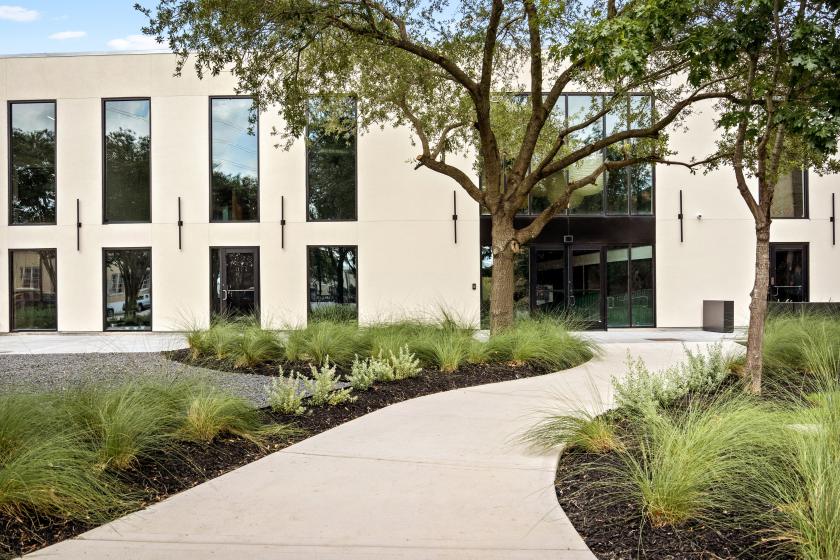
- • ±33,000 SF office building
- • Creative workspace
- • Year Built: 1927
Additional Photos

Listing Agents

Jeff Peltier
O: 713-830-2182
M: 281-827-5922
jeff.peltier@colliers.com
O: 713-830-2182
M: 281-827-5922
jeff.peltier@colliers.com
While we strive to provide the most accurate information, all listing information, and demographic data, is provided by third-parties. As such, MyEListing will not be responsible for the accuracy of the information. It is strongly recommended that you verify all information with the listing agent, and any relevant agencies, prior to making any decisions.