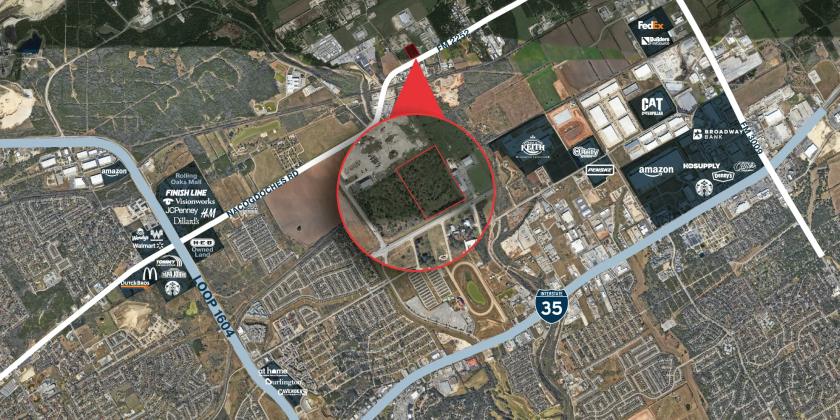
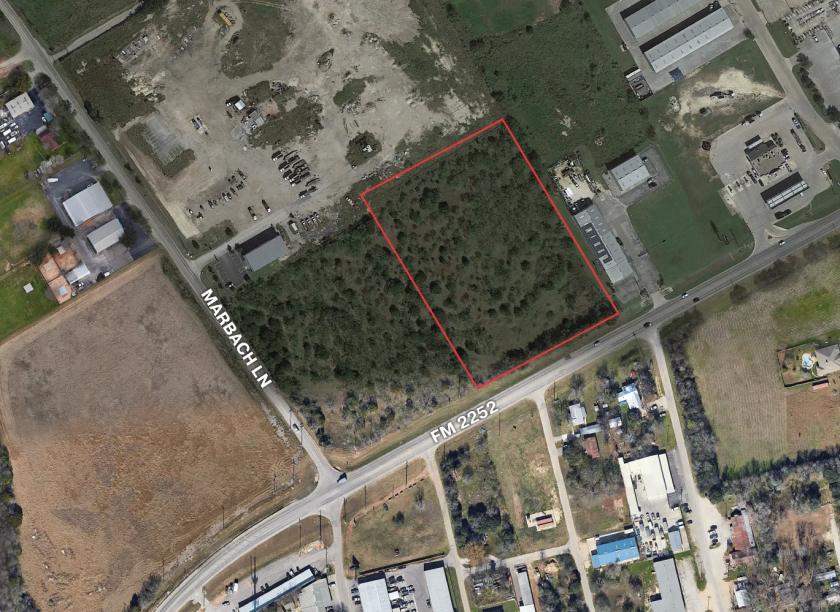
1-Mile | 3-Miles | 5-Miles | ||
---|---|---|---|---|
Total Population | 1,365 | 25,507 | 127,992 | |
Population Median Age | 35 | 37 | 37 | |
Population by Age | 0-9 Yrs | 221 (16%) | 3522 (13%) | 17206 (13%) |
10-19 Yrs | 143 (10%) | 2736 (10%) | 16892 (13%) | |
20-29 Yrs | 210 (15%) | 4068 (15%) | 17743 (13%) | |
30-39 Yrs | 238 (17%) | 3902 (15%) | 19311 (15%) | |
40-49 Yrs | 163 (11%) | 3397 (13%) | 17420 (13%) | |
50-59 Yrs | 199 (14%) | 3480 (13%) | 16369 (12%) | |
60-69 Yrs | 132 (9%) | 2731 (10%) | 13096 (10%) | |
70+ Yrs | 59 (4%) | 1671 (6%) | 9956 (7%) | |
Median HH Income | $94,704 | $88,502 | $76,034 | |
Total Household Income | < 24K | 23 (4%) | 841 (9%) | 4974 (11%) |
25-49K | 60 (12%) | 1338 (14%) | 7337 (16%) | |
50-74K | 94 (19%) | 1674 (18%) | 9783 (21%) | |
75-99K | 84 (17%) | 1458 (15%) | 7049 (15%) | |
100-199K | 192 (39%) | 3321 (35%) | 12801 (28%) | |
200K+ | 33 (6%) | 649 (6%) | 2829 (6%) | |
Highest Education Level | No Diploma | 66 | 825 | 5059 |
Diploma or GED | 180 | 3524 | 20348 | |
Some College | 285 | 4208 | 20524 | |
Assoc. Degree | 68 | 1664 | 9305 | |
Bachelors Degree | 224 | 4369 | 18954 | |
Higher Degree | 111 | 3027 | 11590 | |
Total Housing Units | 516 | 9,606 | 46,476 | |
--Owner-Occupied | 301 | 6,054 | 31,215 | |
--Renter-Occupied | 185 | 3,228 | 13,559 | |
Owner-Occupied Values | < 100K | 13 | 190 | 2336 |
100-199K | 115 | 1937 | 13331 | |
200-299K | 94 | 2450 | 10877 | |
300-399K | 17 | 682 | 2912 | |
400-499K | 10 | 385 | 773 | |
500K+ | 53 | 411 | 986 | |
Total Working Age Population | 1,054 | 20,291 | 100,006 | |
In Work Force | 826 | 14,495 | 68,013 | |
Not In Work Force | 228 | 5,796 | 31,993 | |
Workforce Employed | 766 | 13,509 | 63,334 | |
Workforce Unemployed | 37 | 582 | 3,124 | |
Civlian Workforce | 803 | 14,091 | 66,458 | |
Military Workforce | 23 | 404 | 1,555 | |
Total Households | 486 | 9,282 | 44,773 | |
Family Households | 345 | 6,357 | 32,510 | |
Non-Family Households | 141 | 2,925 | 12,264 | |
Married Couple | 287 | 5,160 | 24,641 | |
Other Family | 58 | 1,196 | 7,869 | |
Married w/Child | 116 | 2,059 | 10,126 | |
Single Male w/Child | 9 | 106 | 853 | |
Single Female w/Child | 21 | 614 | 3,727 |
Population Change Last Two Decades - Plus Projection
2000 | % | 2010 | % | 2020 | % | 2030 | |
---|---|---|---|---|---|---|---|
Texas | 20,851,820 | +21 | 25,145,561 | +18 | 29,677,668 | +18 | 34,894,452 |
Bexar County | 1,392,931 | +23 | 1,714,773 | +22 | 2,093,502 | +20 | 2,502,617 |
Guadalupe County | 89,023 | +48 | 131,533 | +29 | 170,266 | +30 | 221,353 |
Comal County | 78,021 | +39 | 108,472 | +36 | 147,330 | +39 | 204,873 |
Total Working Age Population:
Total Households:
Total Working Age Population:
Total Households:
Total Working Age Population:
Total Households: