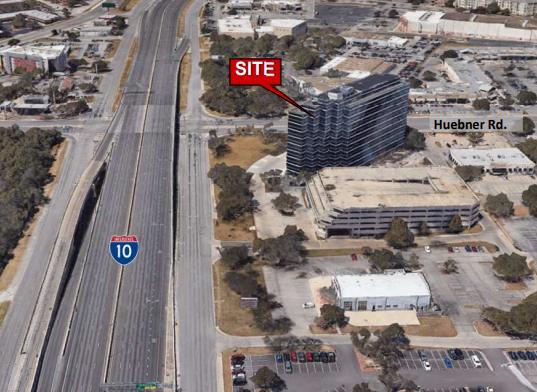
1-Mile | 3-Miles | 5-Miles | ||
---|---|---|---|---|
Total Population | 19,677 | 135,504 | 338,859 | |
Population Median Age | 34 | 36 | 36 | |
Population by Age | 0-9 Yrs | 2633 (13%) | 17399 (12%) | 41709 (12%) |
10-19 Yrs | 1949 (9%) | 13996 (10%) | 41048 (12%) | |
20-29 Yrs | 5149 (26%) | 30334 (22%) | 68892 (20%) | |
30-39 Yrs | 3256 (16%) | 22332 (16%) | 52389 (15%) | |
40-49 Yrs | 2323 (11%) | 15257 (11%) | 39738 (11%) | |
50-59 Yrs | 1588 (8%) | 12786 (9%) | 35830 (10%) | |
60-69 Yrs | 1510 (7%) | 11484 (8%) | 29170 (8%) | |
70+ Yrs | 1269 (6%) | 11916 (8%) | 30084 (8%) | |
Median HH Income | $48,792 | $56,376 | $55,925 | |
Total Household Income | < 24K | 1939 (23%) | 10763 (19%) | 26973 (20%) |
25-49K | 2332 (28%) | 13327 (24%) | 31264 (24%) | |
50-74K | 1623 (19%) | 10443 (19%) | 23930 (18%) | |
75-99K | 750 (9%) | 6584 (12%) | 15578 (11%) | |
100-199K | 1415 (17%) | 10331 (18%) | 24741 (19%) | |
200K+ | 221 (2%) | 3003 (5%) | 7717 (5%) | |
Highest Education Level | No Diploma | 1084 | 7330 | 21935 |
Diploma or GED | 2813 | 15819 | 42571 | |
Some College | 2711 | 20710 | 52543 | |
Assoc. Degree | 884 | 6957 | 18407 | |
Bachelors Degree | 3719 | 23283 | 52911 | |
Higher Degree | 1712 | 16961 | 34713 | |
Total Housing Units | 9,160 | 60,304 | 143,183 | |
--Owner-Occupied | 1,913 | 19,830 | 56,861 | |
--Renter-Occupied | 6,367 | 34,621 | 73,343 | |
Owner-Occupied Values | < 100K | 86 | 1056 | 4694 |
100-199K | 876 | 5753 | 21460 | |
200-299K | 505 | 7205 | 16178 | |
300-399K | 261 | 3635 | 7989 | |
400-499K | 80 | 709 | 2704 | |
500K+ | 105 | 1472 | 3835 | |
Total Working Age Population | 15,865 | 109,735 | 274,681 | |
In Work Force | 11,911 | 76,302 | 187,843 | |
Not In Work Force | 3,954 | 33,432 | 86,837 | |
Workforce Employed | 11,281 | 72,643 | 177,496 | |
Workforce Unemployed | 582 | 3,260 | 9,226 | |
Civlian Workforce | 11,863 | 75,903 | 186,722 | |
Military Workforce | 48 | 400 | 1,121 | |
Total Households | 8,281 | 54,452 | 130,204 | |
Family Households | 3,823 | 28,001 | 71,630 | |
Non-Family Households | 4,458 | 26,451 | 58,574 | |
Married Couple | 2,114 | 18,933 | 48,910 | |
Other Family | 1,709 | 9,068 | 22,720 | |
Married w/Child | 906 | 8,007 | 20,102 | |
Single Male w/Child | 105 | 874 | 2,384 | |
Single Female w/Child | 659 | 3,570 | 8,703 |
Population Change Last Two Decades - Plus Projection
2000 | % | 2010 | % | 2020 | % | 2030 | |
---|---|---|---|---|---|---|---|
Texas | 20,851,820 | +21 | 25,145,561 | +18 | 29,677,668 | +18 | 34,894,452 |
Bexar County | 1,392,931 | +23 | 1,714,773 | +22 | 2,093,502 | +20 | 2,502,617 |
Total Working Age Population:
Total Households:
Total Working Age Population:
Total Households:
Total Working Age Population:
Total Households: