Industrial Properties
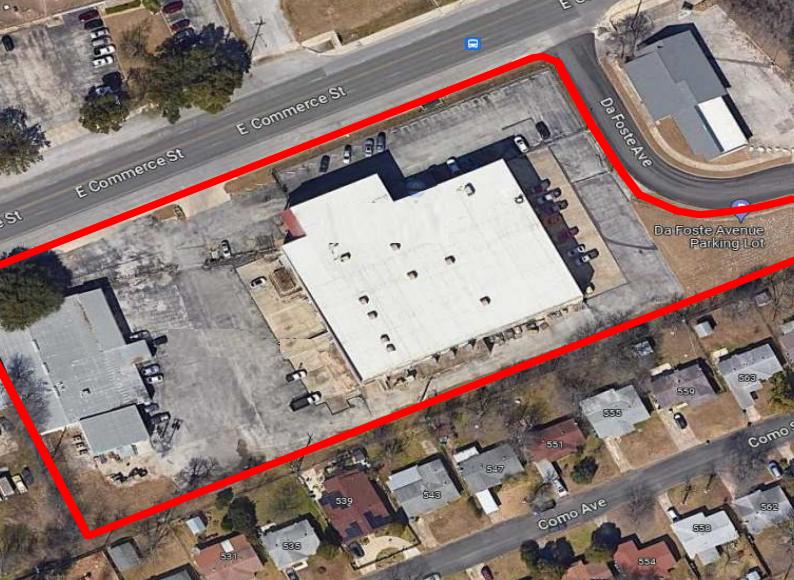
3444 and 3430 E. Commerce San Antonio, TX 78220
3444 and 3430 E. Commerce San Antonio, TX 78220
Details & Description
Listing Agents

Steve Garza
O: 210-876-2238
steve.garza@partnersrealestate.com
O: 210-876-2238
steve.garza@partnersrealestate.com
While we strive to provide the most accurate information, all listing information, and demographic data, is provided by third-parties. As such, MyEListing will not be responsible for the accuracy of the information. It is strongly recommended that you verify all information with the listing agent, and any relevant agencies, prior to making any decisions.
