Flexible workspace in Richardson Telecom
Prestigious technology hub.
Set up office in our centre in the Palisades Central II and your neighbours will include many of the world's largest telecoms corporations. With excellent road and air connectivity, you'll be conveniently situated for easy access across the Dallas region and beyond.
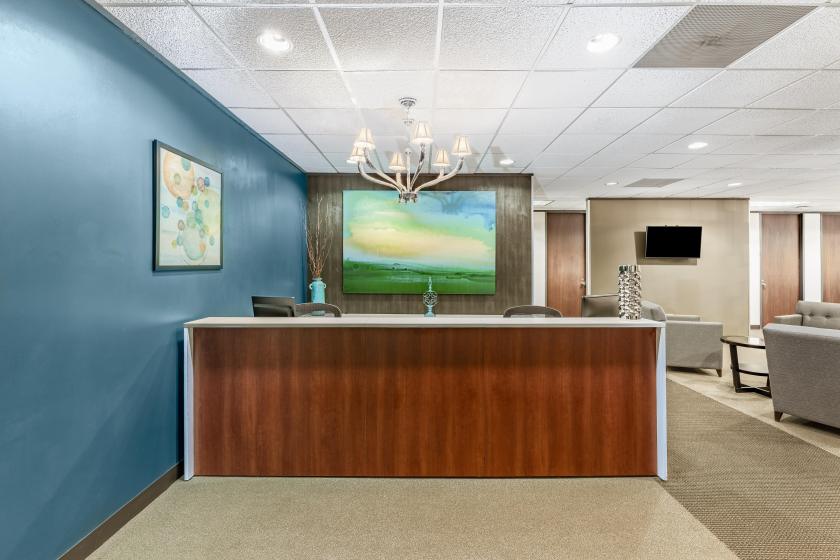
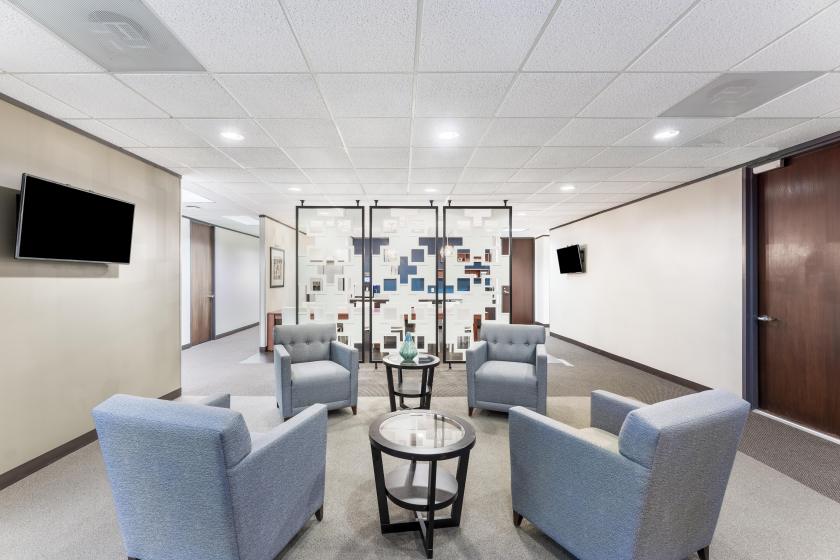
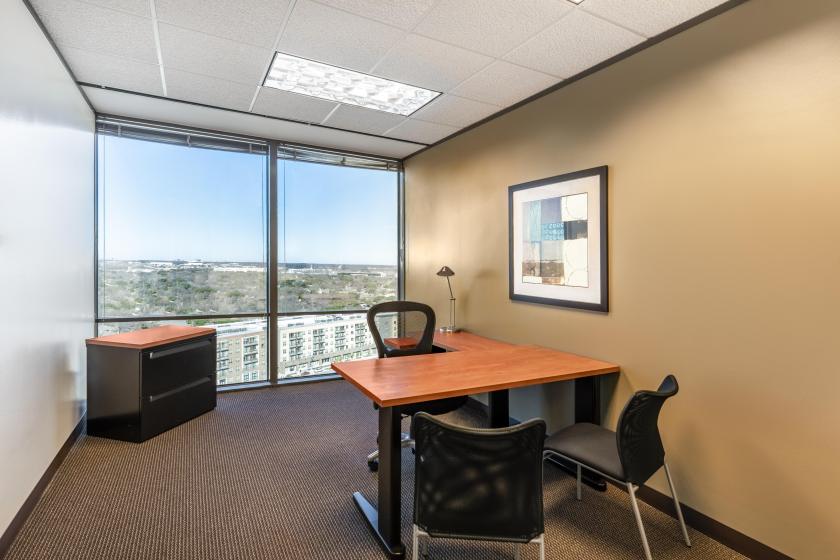
Sitting in fountain-adorned surroundings, our striking glass-fronted centre is designed to impress. There's a lounge and outside seating area together with on-site parking. For visiting clients there's a number of hotels within walking distance. At Regus Richardson Telecom, we can support with:
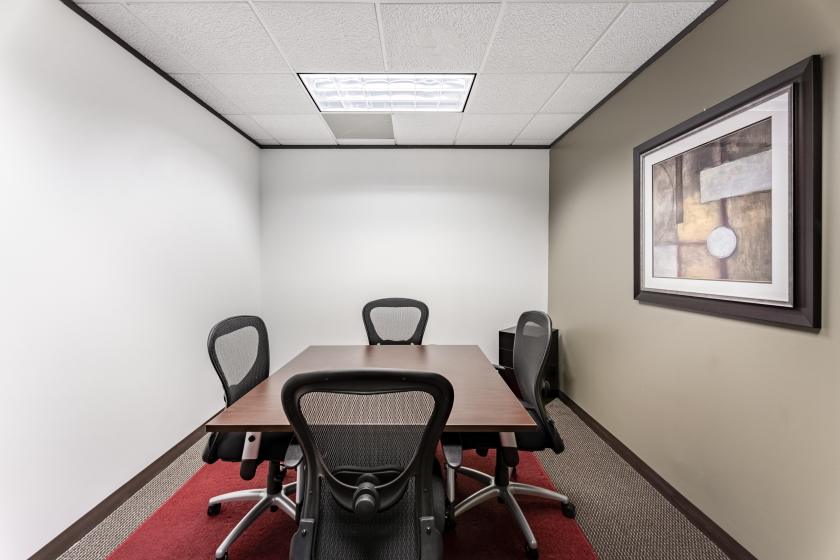
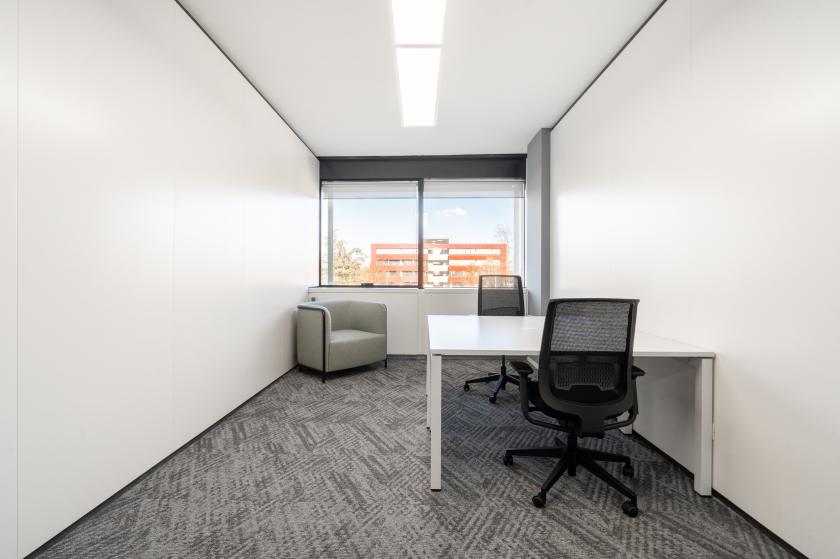
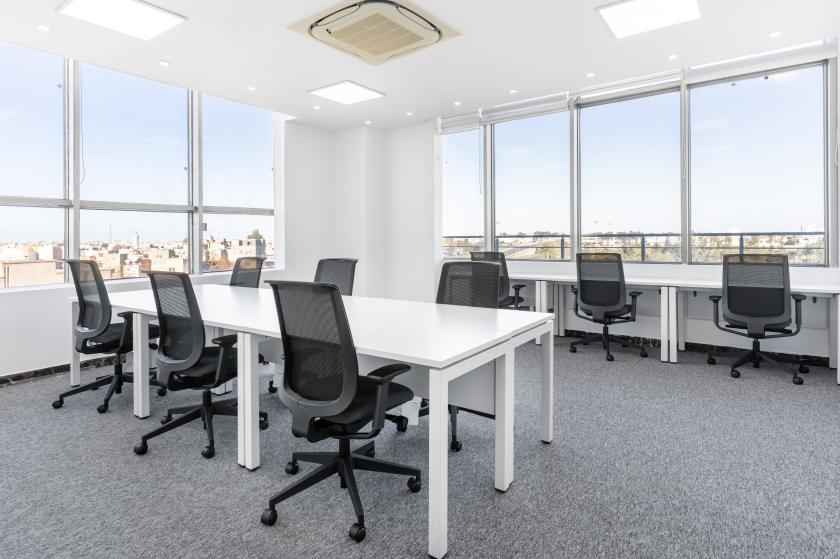
• Office Space: Private, fully furnished and equipped offices for one person or an entire company and fully tailored to your needs. Options range from serviced to custom office spaces to disaster recovery spaces and day offices – with access as and when you need it.
• Coworking: Our coworking spaces are designed with collaboration in mind and come with all the details taken care of. Reserve a dedicated desk or drop in and hot-desk and open your business up to new possibilities.
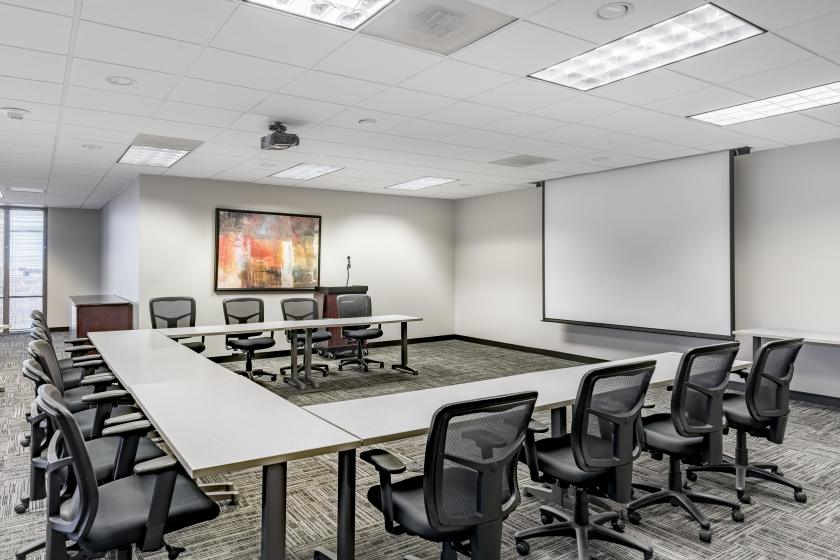
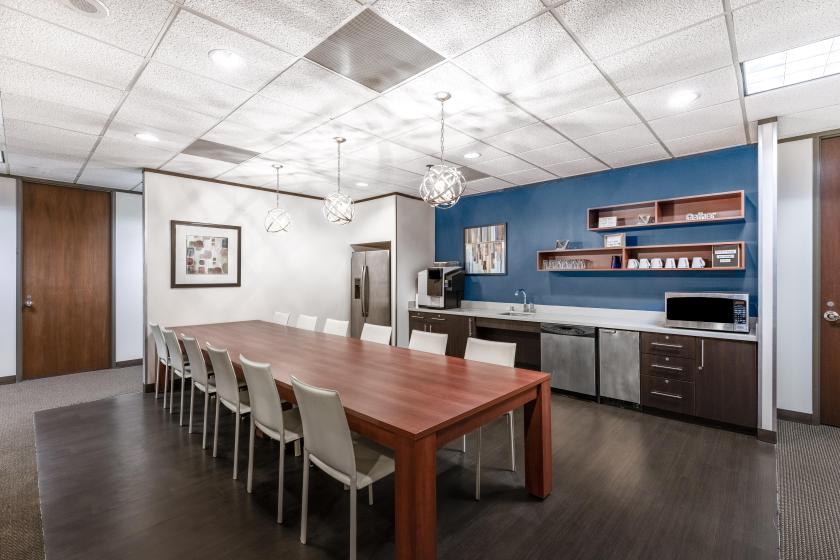
• Meeting Rooms: Our meeting rooms offer the perfect setting for your next pitch, interview or workshop. They come with the latest technology, a friendly support team to ensure everything runs smoothly, and catering if you need it.
• Virtual Office: Our virtual offices are available in every major town and city worldwide, so you can represent your business professionally. Choose your new virtual address now and build your own plan with mail forwarding and call answering services available.
• Membership: With multiple options ranging from office, coworking of lounge access, we offer the flexibility and freedom to accommodate any workstyle. Simply walk into any location across our extensive global network and get to work – as often as you need.
All images shown in this listing belong to our locations but may not correspond to this specific centre.
All prices indicate ‘starting at’ pricing and is subject to change, based on selection and services included.
Enquire now.
No part of this information may be copied, reproduced, repurposed, or screen-captured for any commercial purpose without prior written authorization from MyEListing.
While we strive to provide the most accurate information, all listing information, and demographic data, is provided by third-parties. As such, MyEListing will not be responsible for the accuracy of the information. It is strongly recommended that you verify all information with the listing agent, and any relevant agencies, prior to making any decisions.
What is the building size of this commercial Office property?
The size of this multi-unit property varies between 25 - 1292 square feet
What kind of Office is the propery at 2435 North Central Expressway?
The property at 2435 North Central Expressway Richardson, TX 75080 is listed as a Professional Office property
What is the population within 1 mile of 2435 North Central Expressway in Richardson?
The population within 1 mile of 2435 North Central Expressway Richardson, TX 75080 is 8,516 people.
Who do I contact for questions about 2435 North Central Expressway?
You should contact the listing agent,
Regus US, for any details regarding this commercial listing.