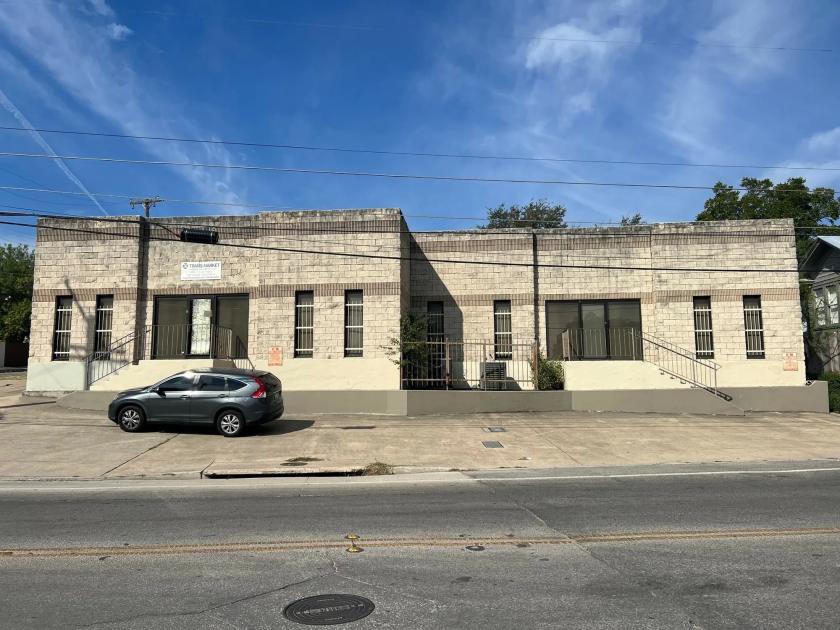
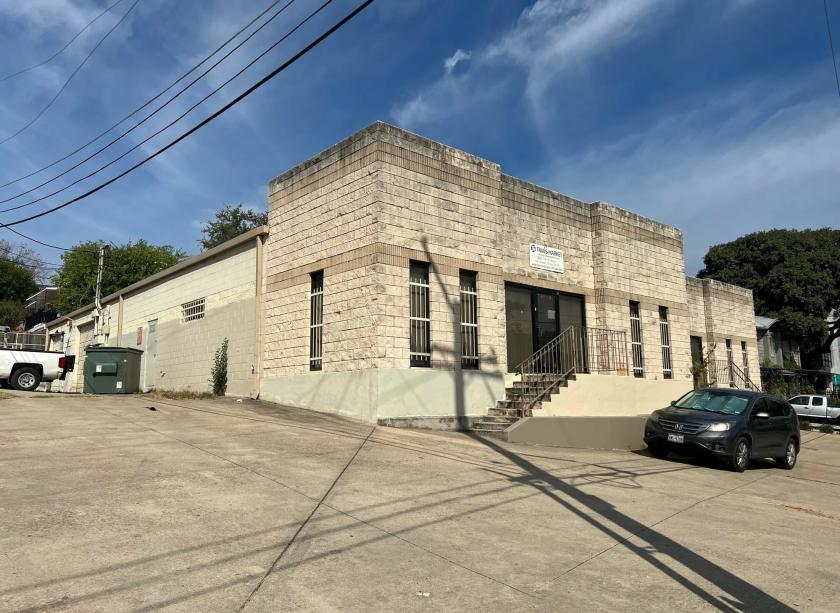
Industrial Properties
2203 North Saint Marys Street San Antonio, TX 78212
2203 North Saint Marys Street San Antonio, TX 78212
Details & Description
Property Highlights
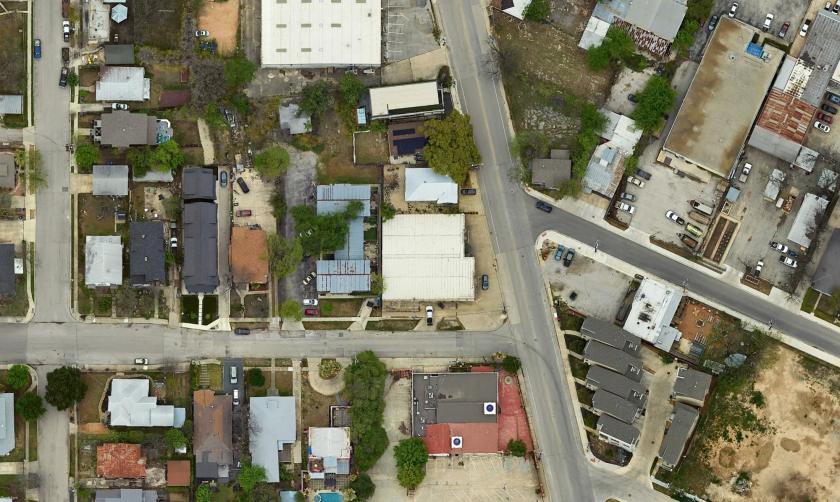
• Rare opportunity to purchase a corner property on the vibrant street of Saint Marys near the acclaimed Pearl Brewery
• Over 1,000 units of new high density Class A residential developments within 1/2 mile of property
Listing Agents

Brian Heines
O: 210-504-3590
brian.heines@partnersrealestate.com
O: 210-504-3590
brian.heines@partnersrealestate.com

Brett Lum
O: 210-384-2347
brett.lum@partnersrealestate.com
O: 210-384-2347
brett.lum@partnersrealestate.com
While we strive to provide the most accurate information, all listing information, and demographic data, is provided by third-parties. As such, MyEListing will not be responsible for the accuracy of the information. It is strongly recommended that you verify all information with the listing agent, and any relevant agencies, prior to making any decisions.