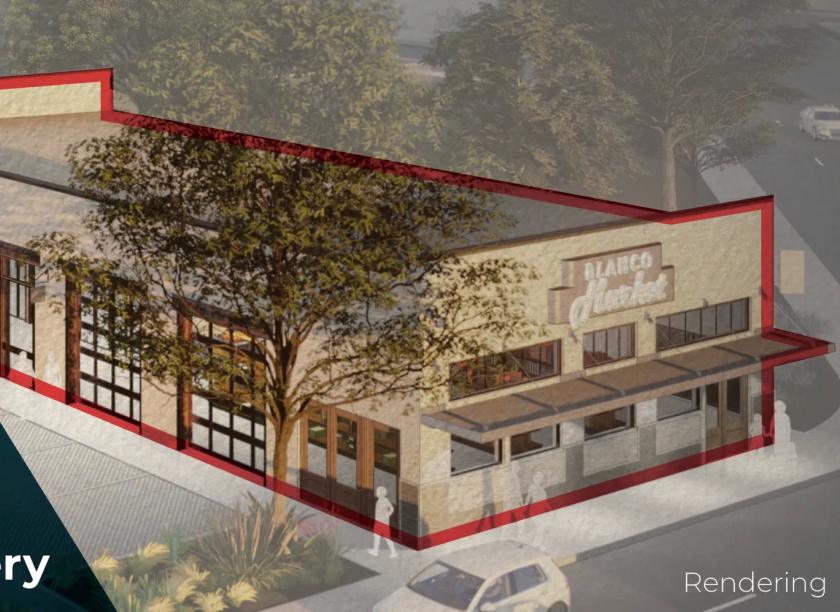
Retail Space
100 Blanco Road San Antonio, TX 78212
100 Blanco Road San Antonio, TX 78212
Details & Description
Property Highlights
- • .33 Acres
- • Zoning: IDZ C-2
- • Parking: 20 Surface Spaces
- • Freestanding Building
- • Hard Corner of Blanco & Fredericksburg
- • Exceptional Exposure at Signalized Intersection
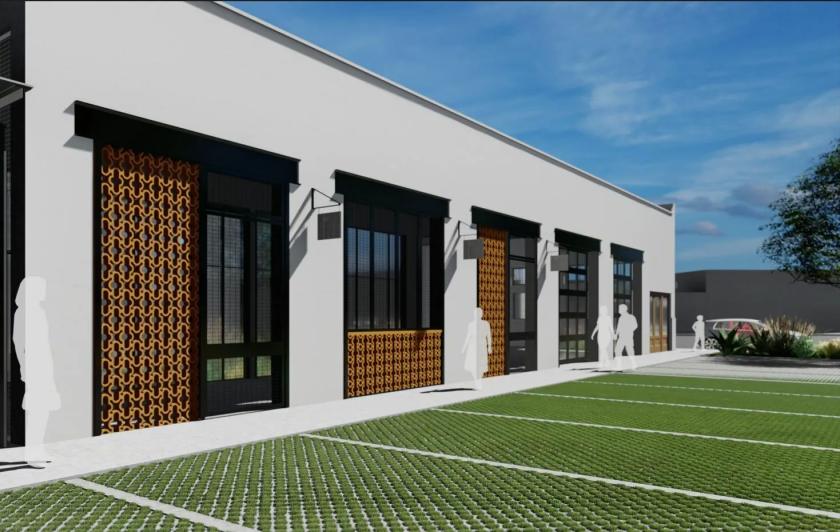
Additional Photos


Listing Agents

Brian Heines
O: 210-504-3590
brian.heines@partnersrealestate.com
O: 210-504-3590
brian.heines@partnersrealestate.com
While we strive to provide the most accurate information, all listing information, and demographic data, is provided by third-parties. As such, MyEListing will not be responsible for the accuracy of the information. It is strongly recommended that you verify all information with the listing agent, and any relevant agencies, prior to making any decisions.


