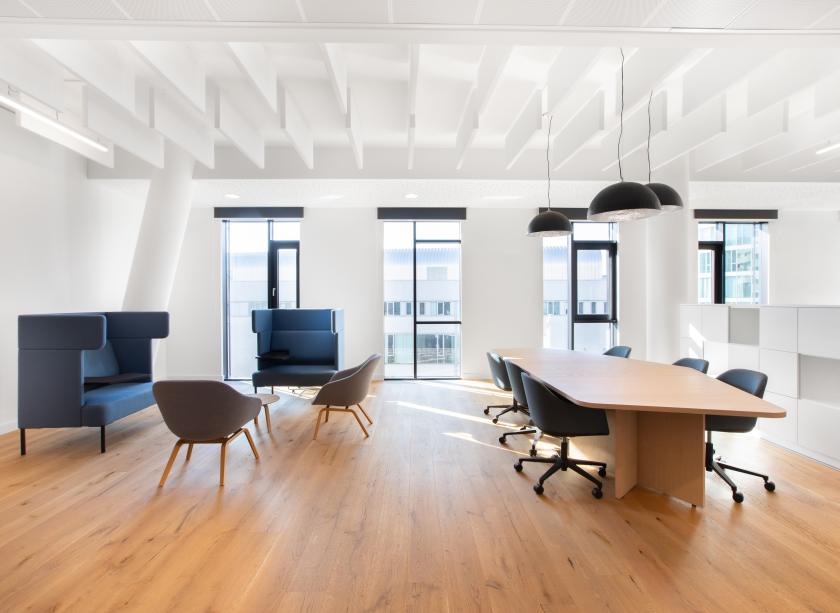
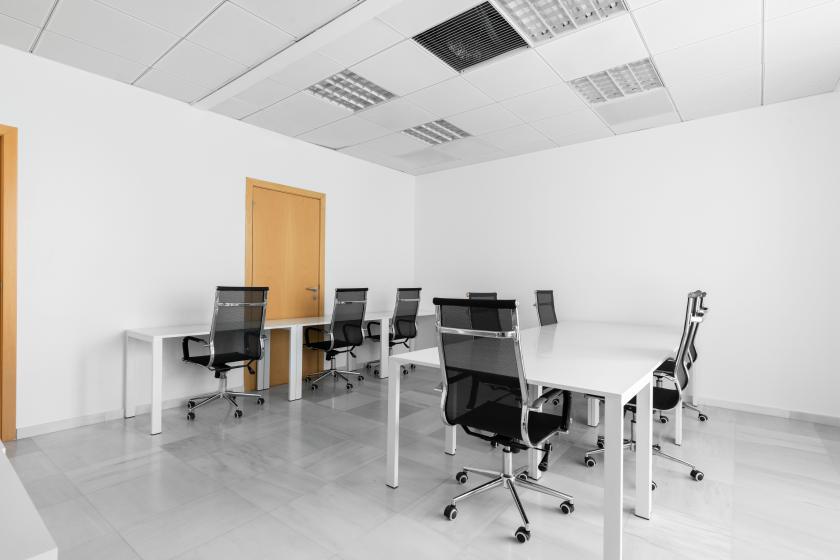
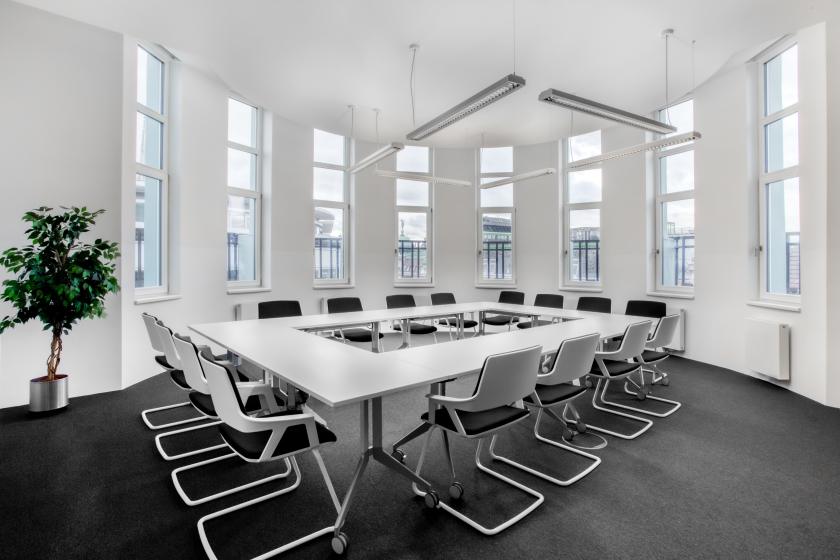
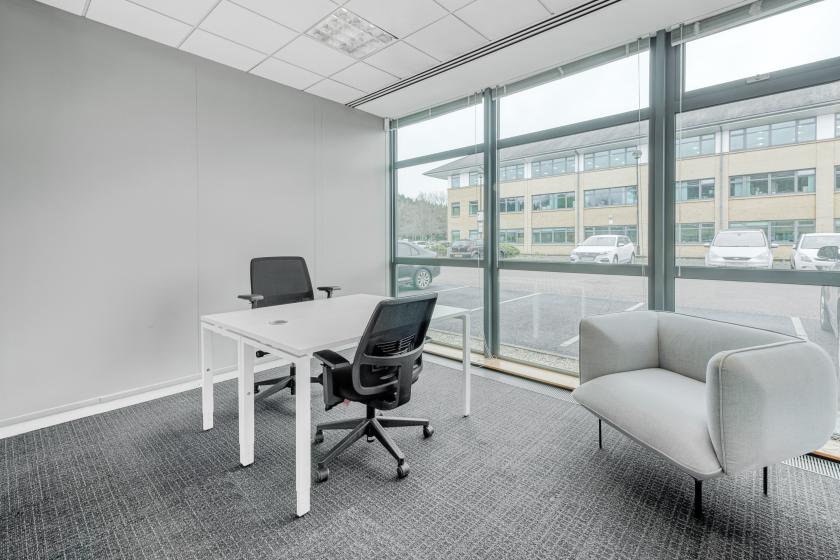
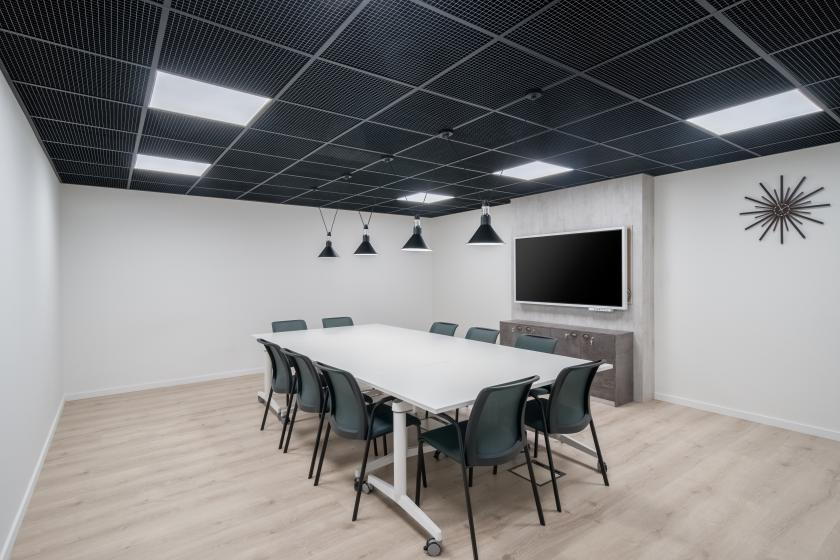
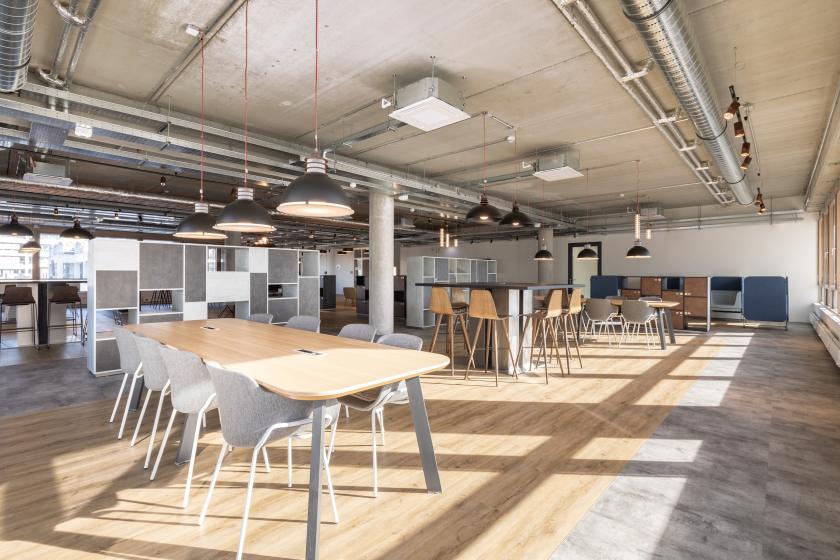
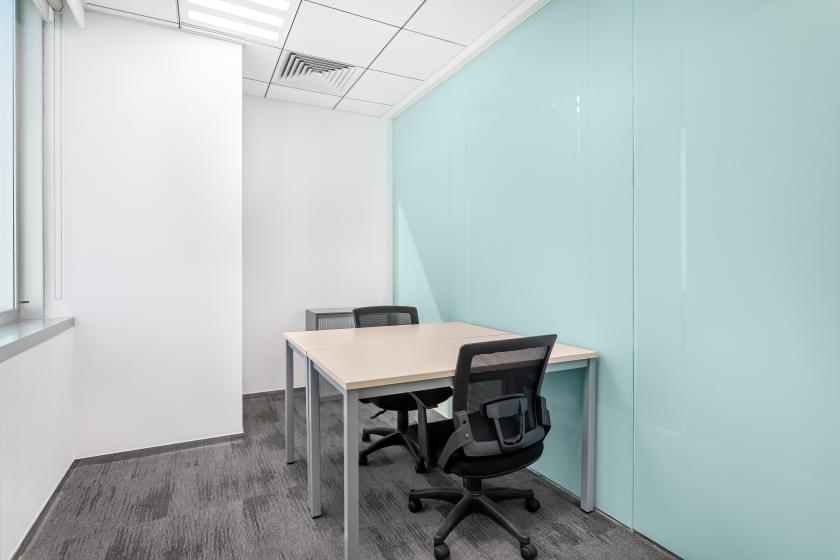
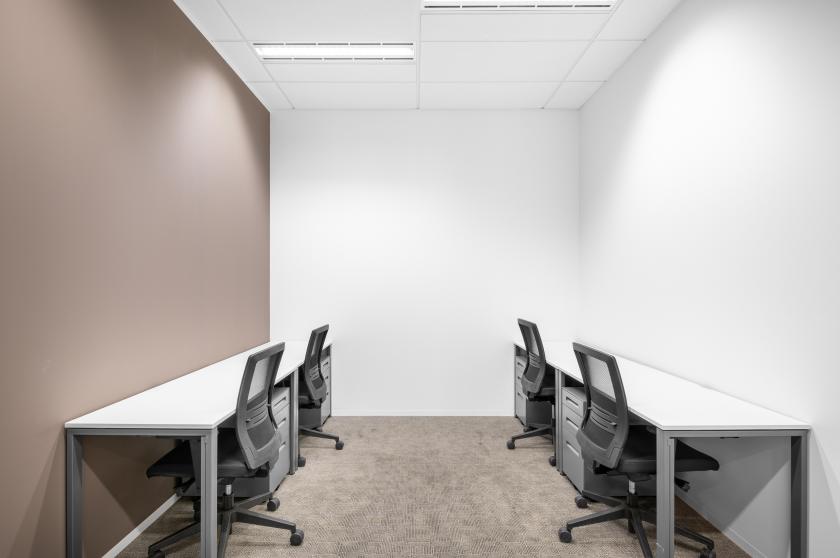
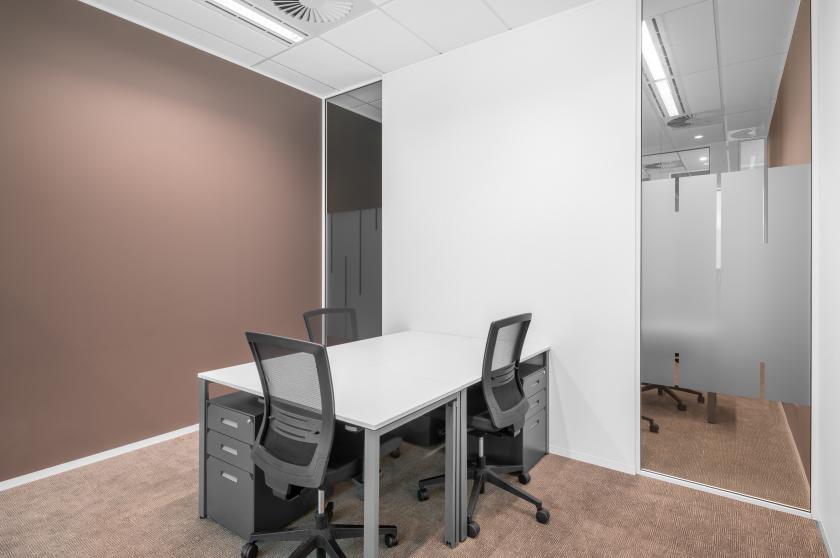
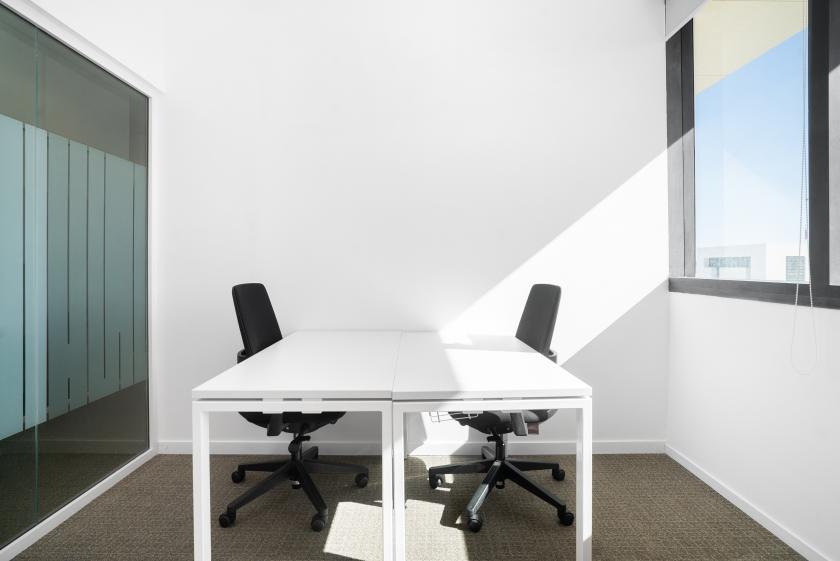
Workspaces, services and support to help you work better in Dominion PlazaMemorable building, mesmerising views.Impress clients and get partners talking in our striking, high-rise Dominion Plaza building, surrounded by greenery and decorated with grand pillars scaling the wall. Designed with floor to ceiling windows, accommodating spectacular views of the city, this is a building to remember.Work up a sweat in our onsite fitness suite and refresh in our coffee bar or nearby restaurants, before utilising our Meeting Rooms for your business needs. At Regus Dominion Plaza, we can support with:• Office Space: Private, fully furnished and equipped offices for one person or an entire company and fully tailored to your needs. Options range from serviced to custom office spaces to disaster recovery spaces and day offices – with access as and when you need it.• Coworking: Our coworking spaces are designed with collaboration in mind and come with all the details taken care of. Reserve a dedicated desk or drop in and hot-desk and open your business up to new possibilities.• Meeting Rooms: Our meeting rooms offer the perfect setting for your next pitch, interview or workshop. They come with the latest technology, a friendly support team to ensure everything runs smoothly, and catering if you need it.• Virtual Office: Our virtual offices are available in every major town and city worldwide, so you can represent your business professionally. Choose your new virtual address now and build your own plan with mail forwarding and call answering services available.• Membership: With multiple options ranging from office, coworking of lounge access, we offer the flexibility and freedom to accommodate any workstyle. Simply walk into any location across our extensive global network and get to work – as often as you need.All images shown in this listing belong to our locations but may not correspond to this specific centre.All prices indicate ‘starting at’ pricing and is subject to change, based on selection and services included.Enquire now.