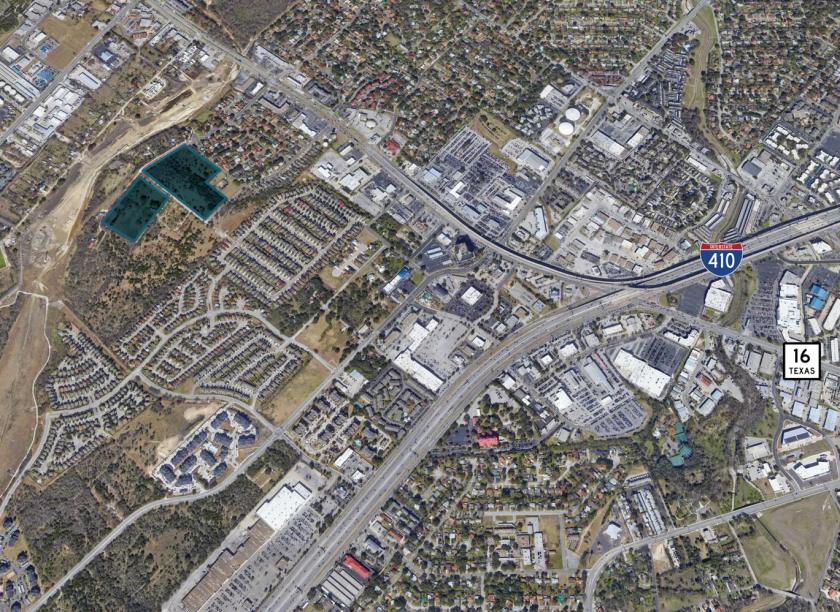
1-Mile | 3-Miles | 5-Miles | ||
---|---|---|---|---|
Total Population | 12,496 | 138,093 | 396,818 | |
Population Median Age | 35 | 36 | 35 | |
Population by Age | 0-9 Yrs | 1934 (15%) | 19138 (13%) | 55747 (14%) |
10-19 Yrs | 1797 (14%) | 19163 (13%) | 52631 (13%) | |
20-29 Yrs | 1829 (14%) | 21837 (15%) | 69512 (17%) | |
30-39 Yrs | 2116 (16%) | 22080 (15%) | 62937 (15%) | |
40-49 Yrs | 1462 (11%) | 16627 (12%) | 46427 (11%) | |
50-59 Yrs | 1242 (9%) | 14277 (10%) | 43065 (10%) | |
60-69 Yrs | 1219 (9%) | 12742 (9%) | 35281 (8%) | |
70+ Yrs | 897 (7%) | 12228 (8%) | 31216 (7%) | |
Median HH Income | $51,705 | $51,934 | $53,880 | |
Total Household Income | < 24K | 1081 (23%) | 10114 (20%) | 28980 (21%) |
25-49K | 1143 (24%) | 13628 (27%) | 34358 (25%) | |
50-74K | 1038 (22%) | 10025 (20%) | 26887 (19%) | |
75-99K | 538 (11%) | 5457 (11%) | 16941 (12%) | |
100-199K | 773 (16%) | 8699 (17%) | 24875 (18%) | |
200K+ | 38 (0%) | 1179 (2%) | 3640 (2%) | |
Highest Education Level | No Diploma | 1015 | 11754 | 35001 |
Diploma or GED | 2262 | 23030 | 65764 | |
Some College | 1997 | 22620 | 61528 | |
Assoc. Degree | 1028 | 9133 | 24731 | |
Bachelors Degree | 1362 | 15790 | 45585 | |
Higher Degree | 430 | 8222 | 25405 | |
Total Housing Units | 5,062 | 52,970 | 146,354 | |
--Owner-Occupied | 2,293 | 23,886 | 68,387 | |
--Renter-Occupied | 2,319 | 25,216 | 67,294 | |
Owner-Occupied Values | < 100K | 207 | 2942 | 12560 |
100-199K | 1600 | 15323 | 37568 | |
200-299K | 456 | 4809 | 14572 | |
300-399K | 30 | 526 | 2618 | |
400-499K | 0 | 121 | 385 | |
500K+ | 0 | 165 | 685 | |
Total Working Age Population | 9,407 | 107,641 | 310,455 | |
In Work Force | 6,103 | 71,357 | 208,476 | |
Not In Work Force | 3,304 | 36,284 | 101,980 | |
Workforce Employed | 5,628 | 65,999 | 194,517 | |
Workforce Unemployed | 357 | 4,769 | 12,036 | |
Civlian Workforce | 5,985 | 70,768 | 206,553 | |
Military Workforce | 118 | 589 | 1,923 | |
Total Households | 4,612 | 49,102 | 135,681 | |
Family Households | 2,986 | 29,739 | 84,002 | |
Non-Family Households | 1,625 | 19,363 | 51,679 | |
Married Couple | 1,970 | 19,429 | 54,013 | |
Other Family | 1,016 | 10,309 | 29,989 | |
Married w/Child | 1,116 | 8,241 | 23,101 | |
Single Male w/Child | 165 | 1,108 | 3,116 | |
Single Female w/Child | 529 | 4,502 | 11,853 |
Population Change Last Two Decades - Plus Projection
2000 | % | 2010 | % | 2020 | % | 2030 | |
---|---|---|---|---|---|---|---|
Texas | 20,851,820 | +21 | 25,145,561 | +18 | 29,677,668 | +18 | 34,894,452 |
Bexar County | 1,392,931 | +23 | 1,714,773 | +22 | 2,093,502 | +20 | 2,502,617 |
Total Working Age Population:
Total Households:
Total Working Age Population:
Total Households:
Total Working Age Population:
Total Households: