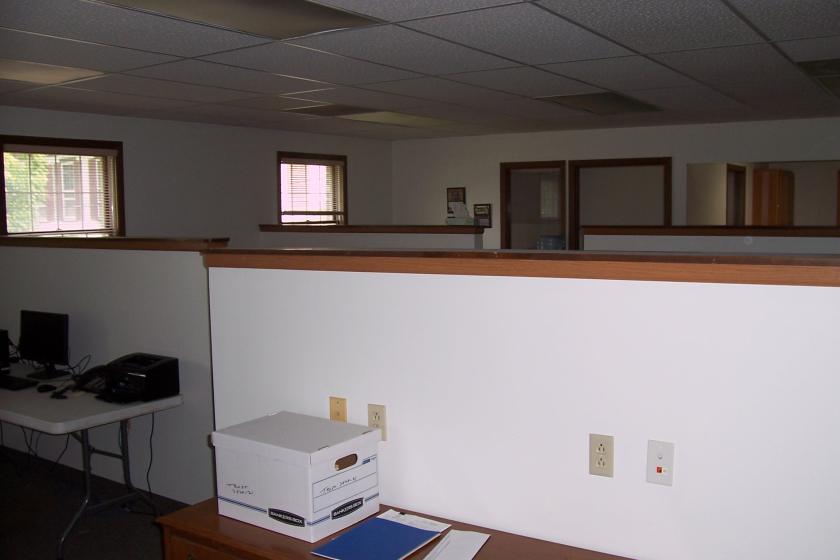
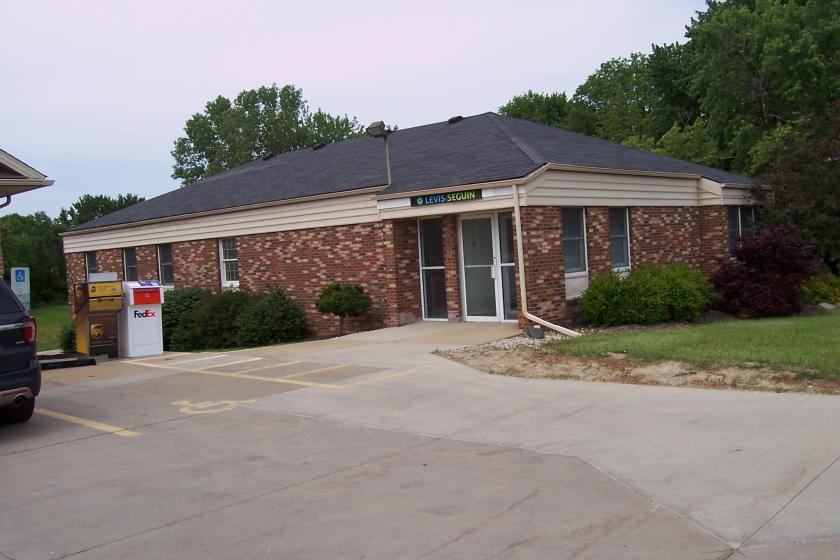
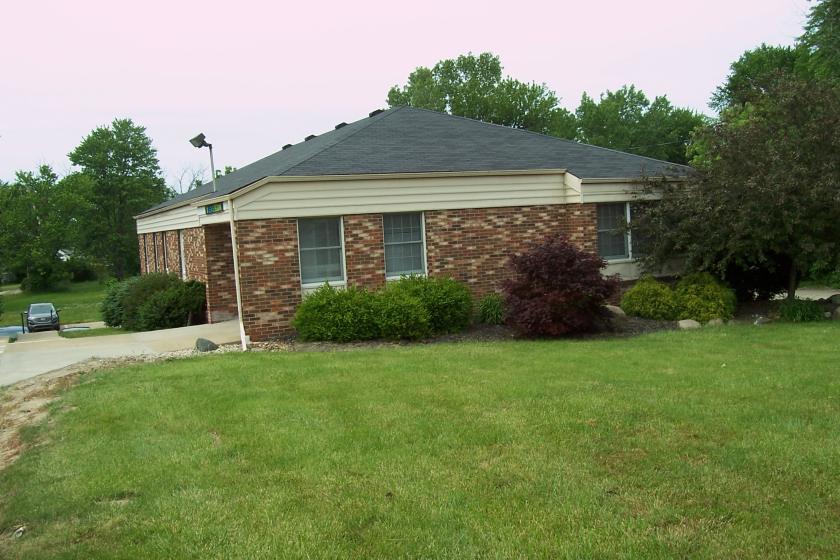
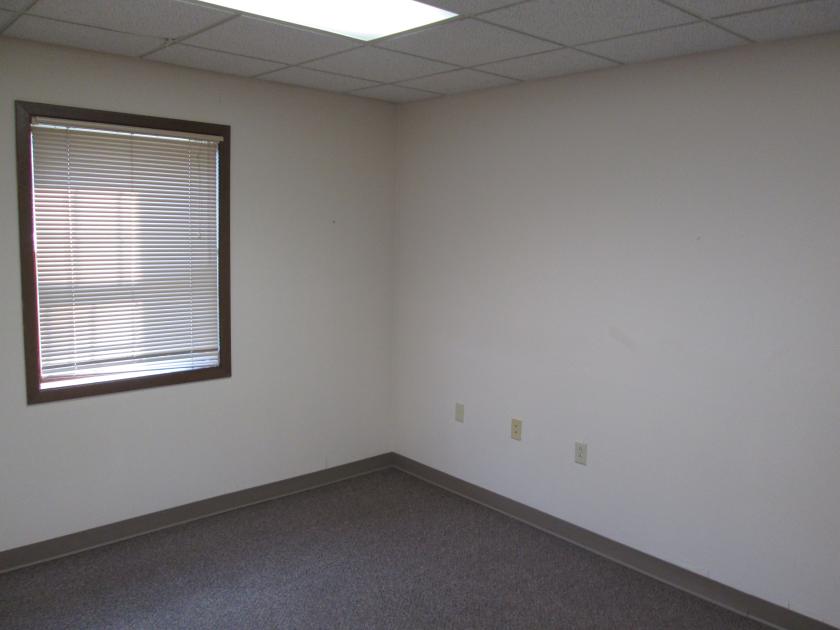
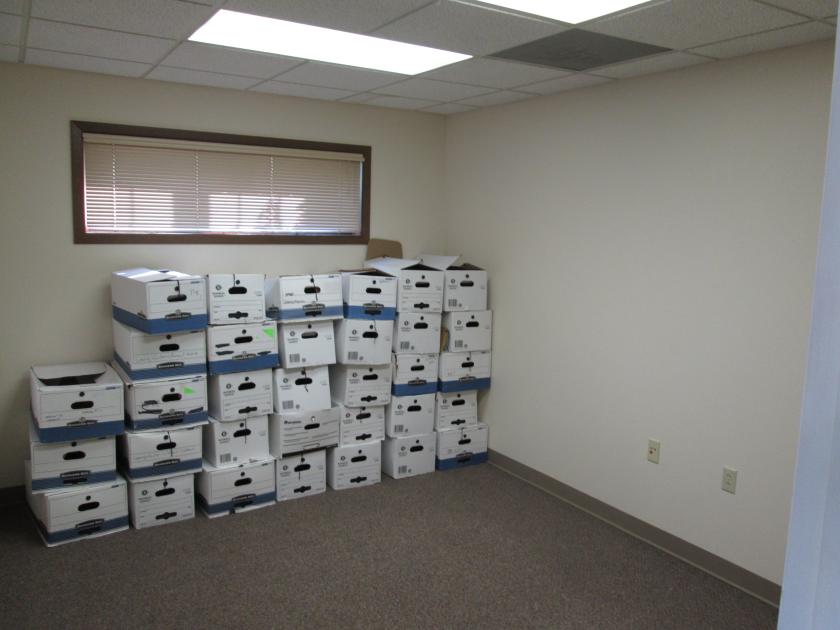
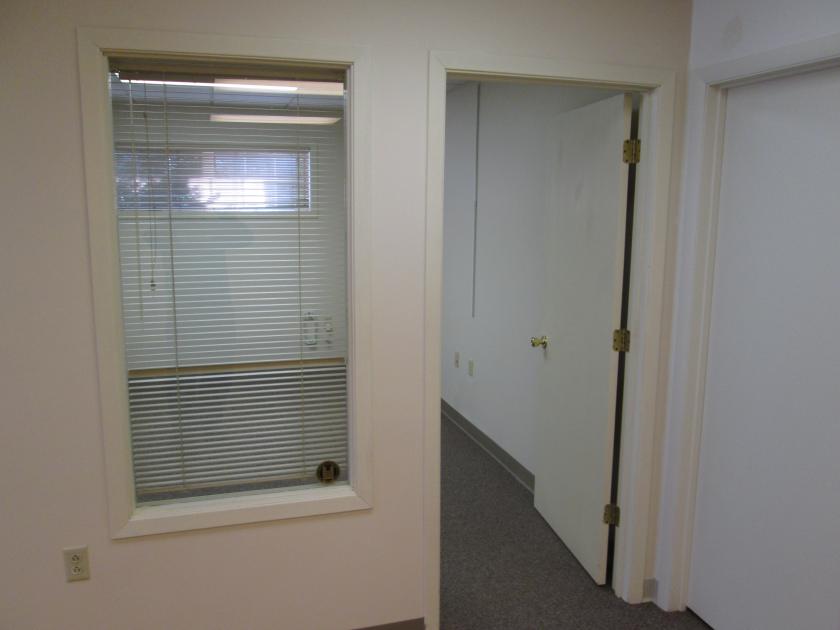
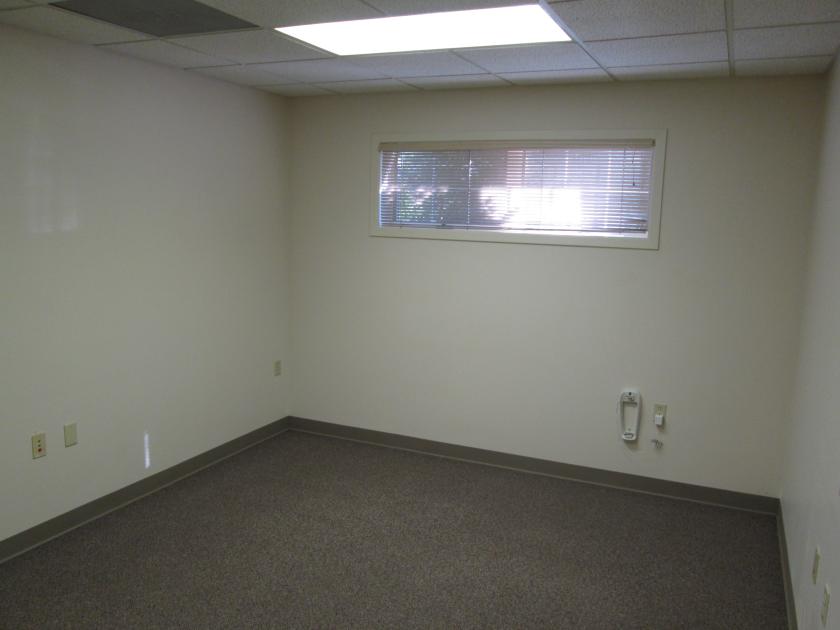
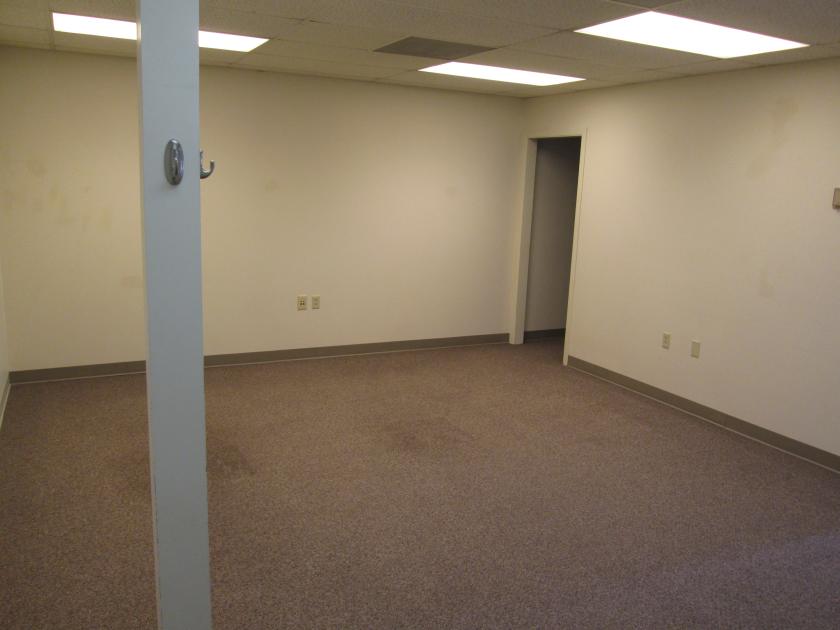
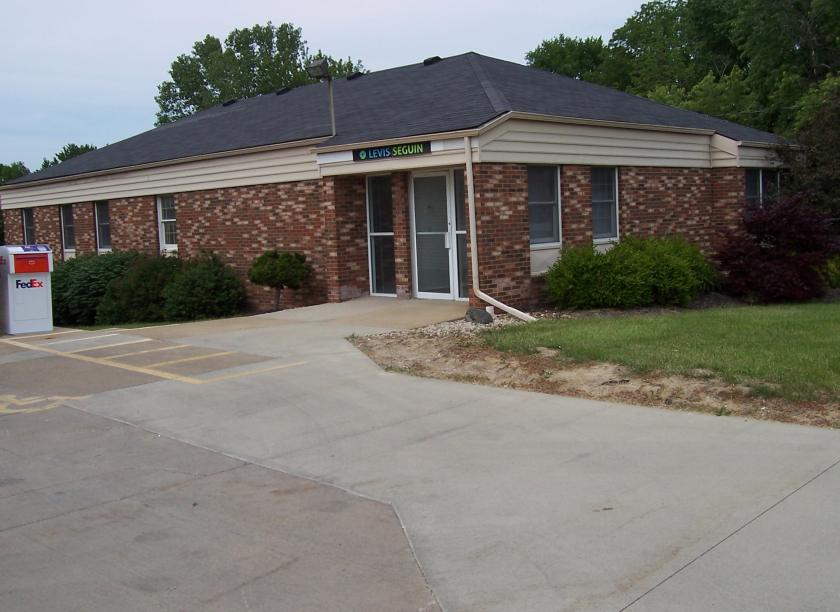
Office Space
168 Cleveland Street Elyria, OH 44035
168 Cleveland Street Elyria, OH 44035
Details & Description
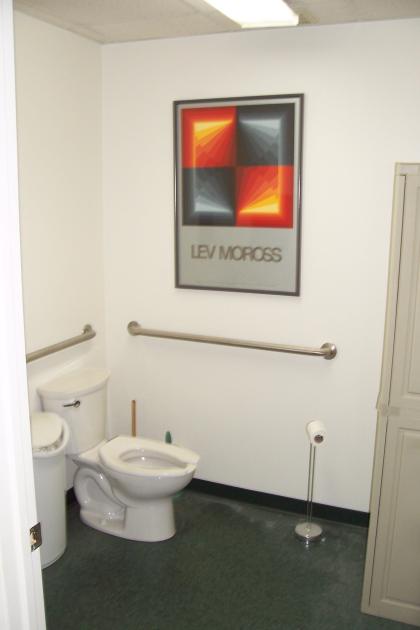
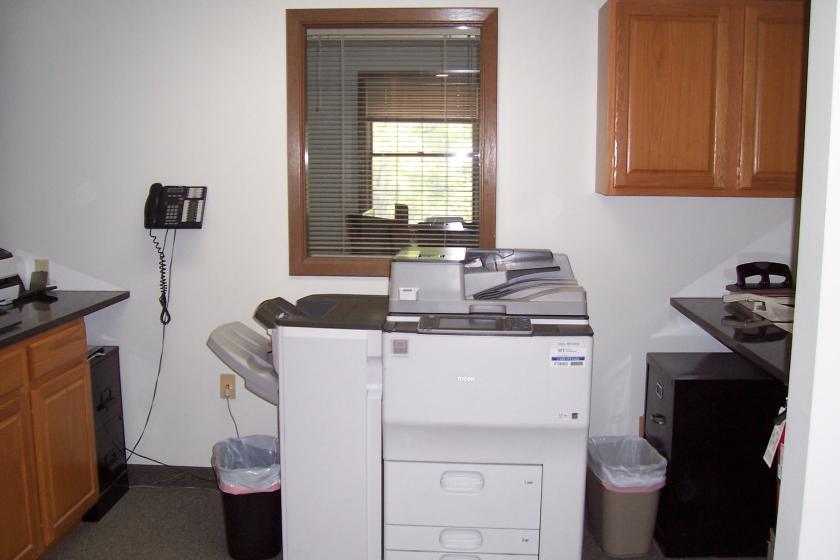
Additional Photos


Listing Agents

Kenneth Weber
O: 440-572-3100
M: 216-299-2449
fairtoall@gmail.com
O: 440-572-3100
M: 216-299-2449
fairtoall@gmail.com
While we strive to provide the most accurate information, all listing information, and demographic data, is provided by third-parties. As such, MyEListing will not be responsible for the accuracy of the information. It is strongly recommended that you verify all information with the listing agent, and any relevant agencies, prior to making any decisions.