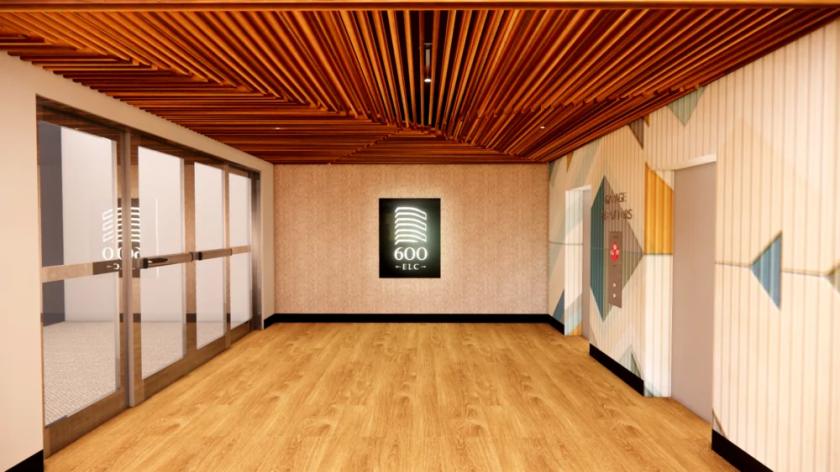
Office Space
600 East Las Colinas Boulevard Irving, TX 75039
600 East Las Colinas Boulevard Irving, TX 75039
Details & Description
Property Highlights
- • $31.00 - $32.00 +E
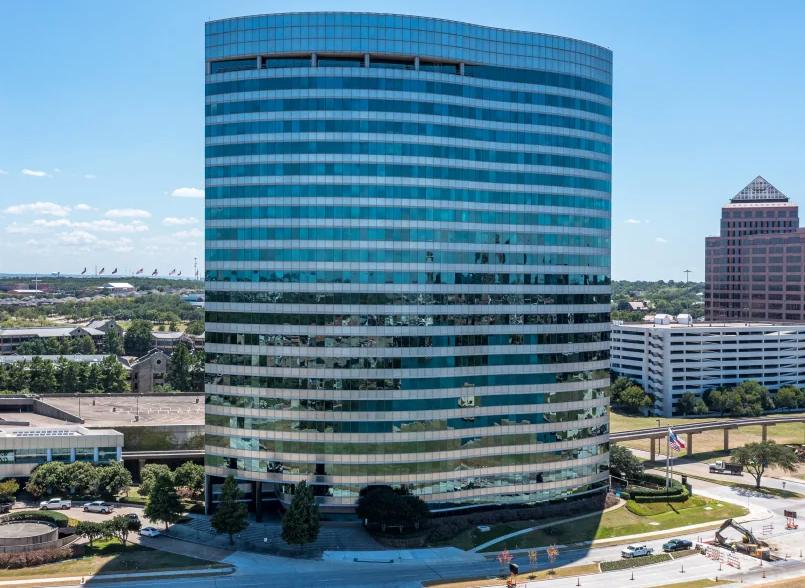
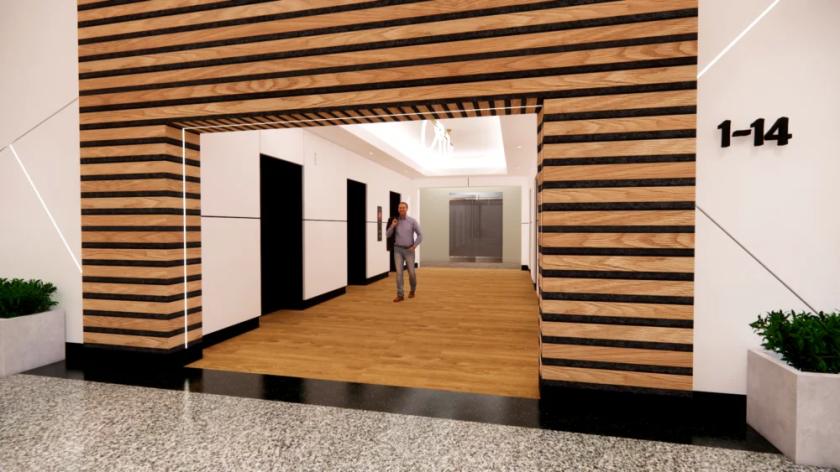
- • 22 Stories
- • On-site property management
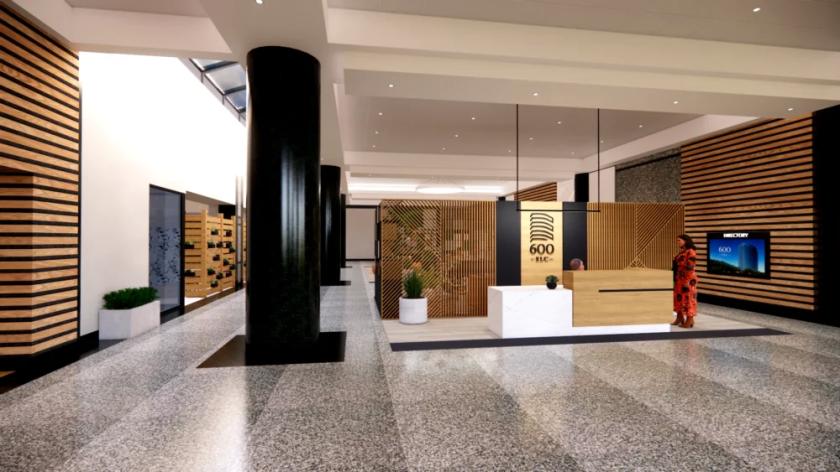
- • Floor to ceiling glass windows
- • 25,109 Typical Floor Size
- • Built in 1984 renovated in 2023
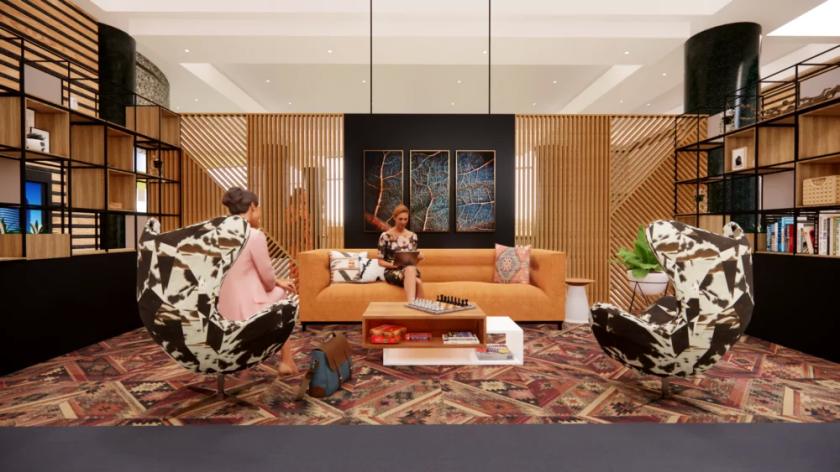
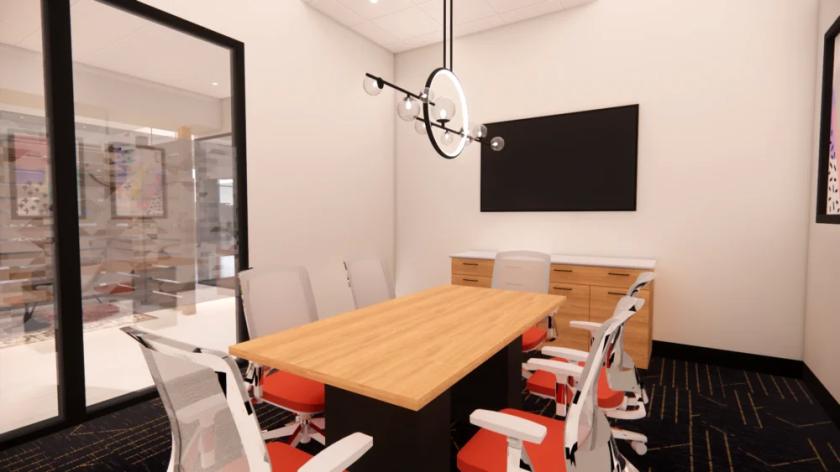
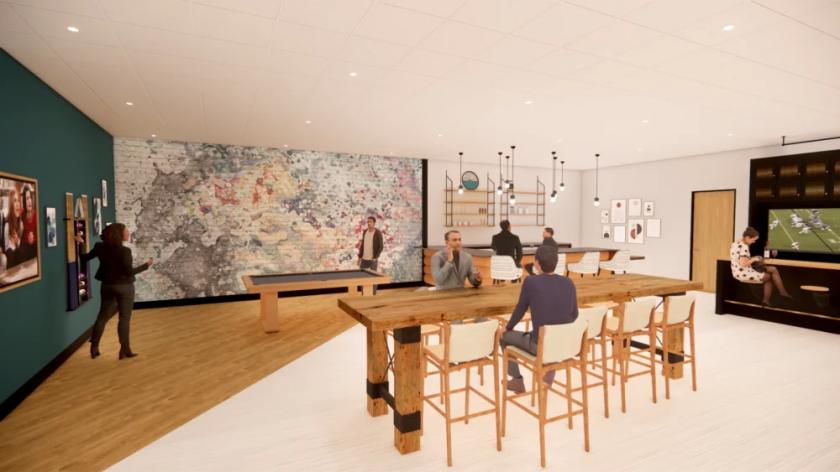
Additional Photos

Listing Agents

Dale Ray
O: 214-261-1036
M: 214-282-2518
dale.ray@avisonyoung.com
O: 214-261-1036
M: 214-282-2518
dale.ray@avisonyoung.com
While we strive to provide the most accurate information, all listing information, and demographic data, is provided by third-parties. As such, MyEListing will not be responsible for the accuracy of the information. It is strongly recommended that you verify all information with the listing agent, and any relevant agencies, prior to making any decisions.