Commercial Land
515 Park Avenue Dallas, TX 75201
515 Park Avenue Dallas, TX 75201
Details & Description
Property Highlights
• DEVELOPMENT OPPORTUNITY SALE, JOINT VENTURE OR GROUND LEASE
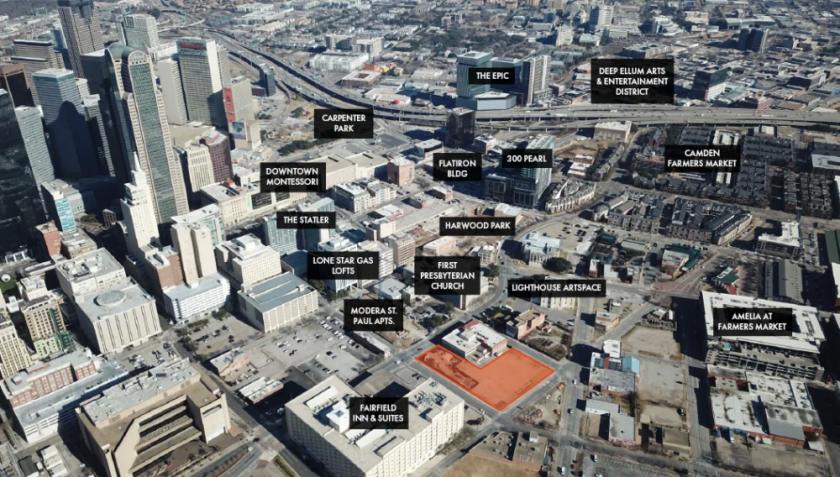
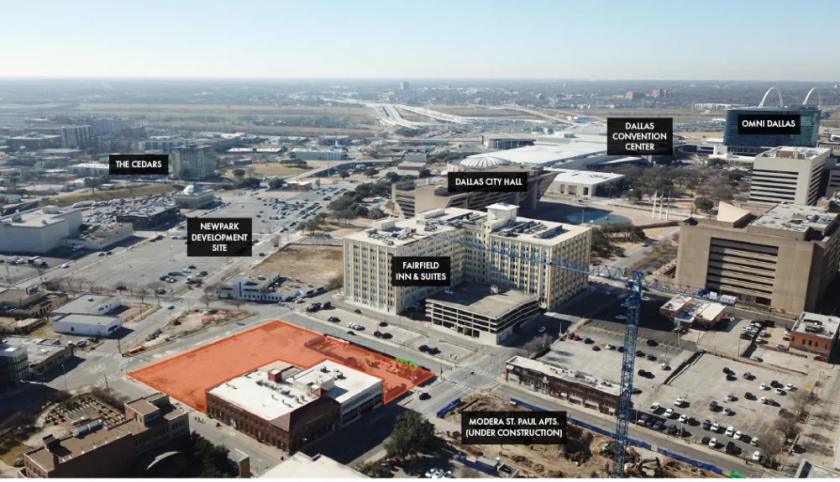
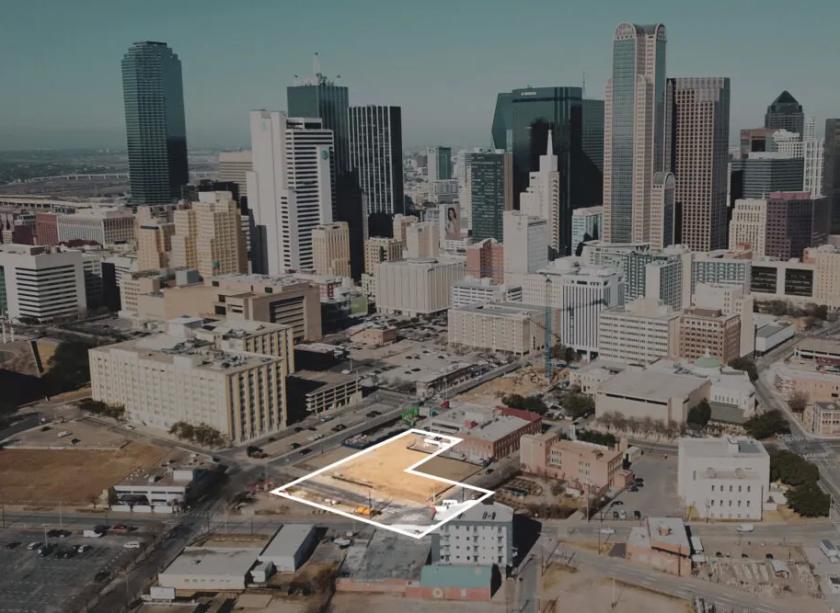
• Rare opportunity in Downtown Dallas
Listing Agents

Stuart Ashmun
O: 512-565-1850
stuart.ashmun@foundrycommercial.com
O: 512-565-1850
stuart.ashmun@foundrycommercial.com
While we strive to provide the most accurate information, all listing information, and demographic data, is provided by third-parties. As such, MyEListing will not be responsible for the accuracy of the information. It is strongly recommended that you verify all information with the listing agent, and any relevant agencies, prior to making any decisions.