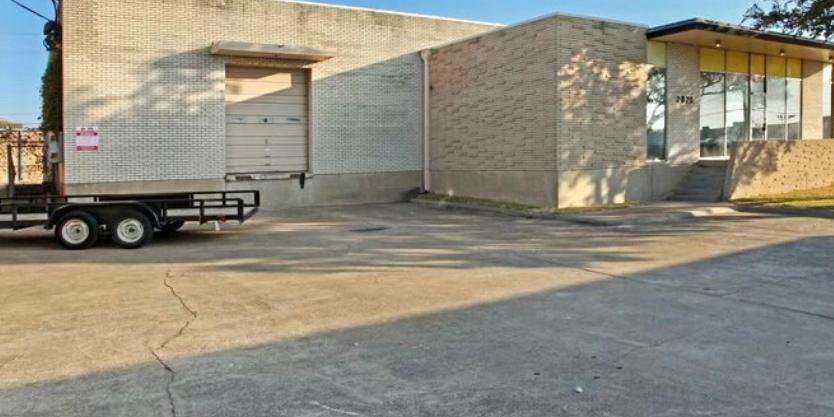
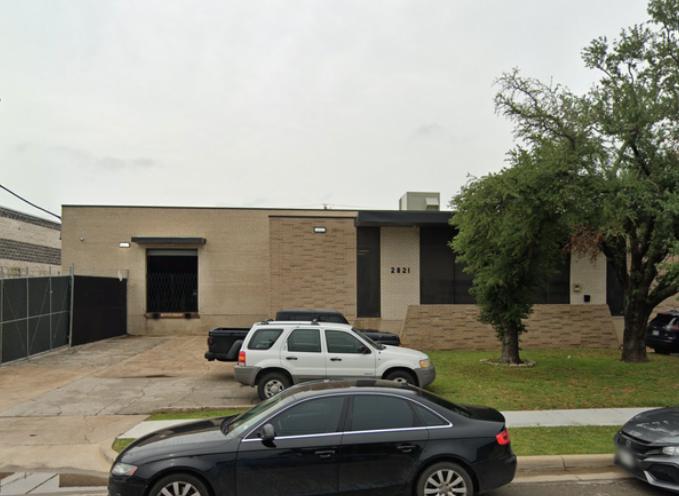
1-Mile | 3-Miles | 5-Miles | ||
---|---|---|---|---|
Total Population | 11,889 | 86,381 | 234,153 | |
Population Median Age | 31 | 34 | 36 | |
Population by Age | 0-9 Yrs | 2002 (16%) | 12731 (14%) | 31545 (13%) |
10-19 Yrs | 2175 (18%) | 11781 (13%) | 28967 (12%) | |
20-29 Yrs | 1598 (13%) | 13086 (15%) | 36653 (15%) | |
30-39 Yrs | 2131 (17%) | 15416 (17%) | 39384 (16%) | |
40-49 Yrs | 1789 (15%) | 11462 (13%) | 32388 (13%) | |
50-59 Yrs | 1078 (9%) | 10182 (11%) | 28552 (12%) | |
60-69 Yrs | 617 (5%) | 6824 (7%) | 20846 (8%) | |
70+ Yrs | 499 (4%) | 4899 (5%) | 15818 (6%) | |
Median HH Income | $52,651 | $64,653 | $73,277 | |
Total Household Income | < 24K | 552 (15%) | 4521 (14%) | 11129 (12%) |
25-49K | 1181 (32%) | 7937 (25%) | 18819 (20%) | |
50-74K | 689 (19%) | 5465 (17%) | 16352 (18%) | |
75-99K | 411 (11%) | 3690 (11%) | 11260 (12%) | |
100-199K | 672 (18%) | 6544 (20%) | 20559 (22%) | |
200K+ | 110 (3%) | 3076 (9%) | 12283 (13%) | |
Highest Education Level | No Diploma | 3376 | 18049 | 33020 |
Diploma or GED | 1449 | 10441 | 25773 | |
Some College | 754 | 7810 | 22020 | |
Assoc. Degree | 186 | 1987 | 6943 | |
Bachelors Degree | 894 | 11469 | 42474 | |
Higher Degree | 342 | 6573 | 28922 | |
Total Housing Units | 3,851 | 34,711 | 99,537 | |
--Owner-Occupied | 1,345 | 13,309 | 40,922 | |
--Renter-Occupied | 2,269 | 17,925 | 49,480 | |
Owner-Occupied Values | < 100K | 205 | 896 | 2508 |
100-199K | 353 | 2745 | 9129 | |
200-299K | 347 | 2883 | 7124 | |
300-399K | 235 | 2300 | 5330 | |
400-499K | 100 | 1571 | 3718 | |
500K+ | 105 | 2914 | 13113 | |
Total Working Age Population | 8,631 | 66,907 | 185,294 | |
In Work Force | 6,349 | 49,382 | 135,050 | |
Not In Work Force | 2,282 | 17,526 | 50,243 | |
Workforce Employed | 6,066 | 47,200 | 129,710 | |
Workforce Unemployed | 282 | 2,182 | 5,232 | |
Civlian Workforce | 6,349 | 49,382 | 134,942 | |
Military Workforce | 0 | 0 | 108 | |
Total Households | 3,613 | 31,233 | 90,402 | |
Family Households | 2,813 | 20,557 | 56,706 | |
Non-Family Households | 801 | 10,676 | 33,695 | |
Married Couple | 1,980 | 14,575 | 42,686 | |
Other Family | 832 | 5,982 | 14,020 | |
Married w/Child | 1,187 | 7,334 | 19,987 | |
Single Male w/Child | 68 | 912 | 1,820 | |
Single Female w/Child | 416 | 2,217 | 5,102 |
Population Change Last Two Decades - Plus Projection
2000 | % | 2010 | % | 2020 | % | 2030 | |
---|---|---|---|---|---|---|---|
Texas | 20,851,820 | +21 | 25,145,561 | +18 | 29,677,668 | +18 | 34,894,452 |
Dallas County | 2,218,899 | +7 | 2,368,139 | +15 | 2,734,111 | +14 | 3,106,298 |
Total Working Age Population:
Total Households:
Total Working Age Population:
Total Households:
Total Working Age Population:
Total Households: