Retail Space
1444 Oak Lawn Avenue Dallas, TX 75207
1444 Oak Lawn Avenue Dallas, TX 75207
Details & Description
Property Highlights
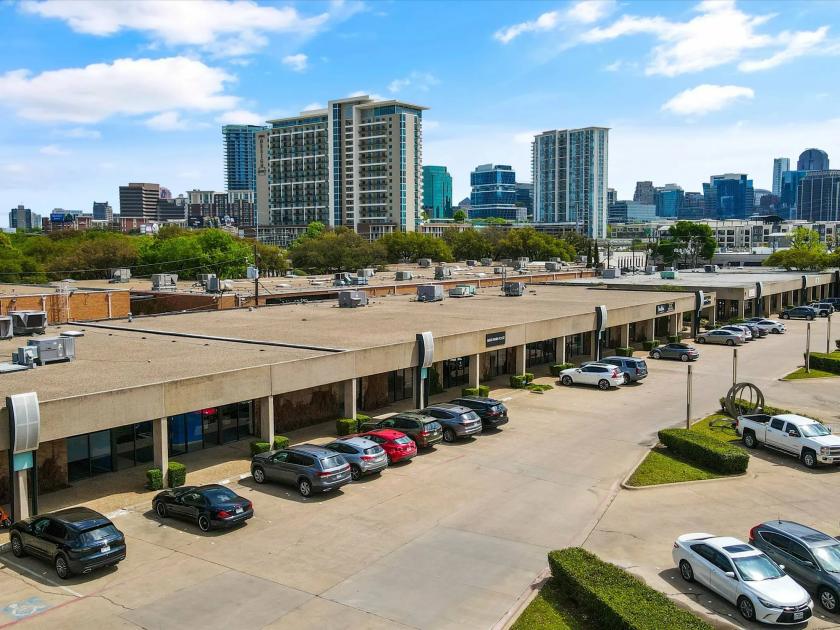
- • In the heart of the design district
- • Open Concept Layout
- • Office or Showroom use
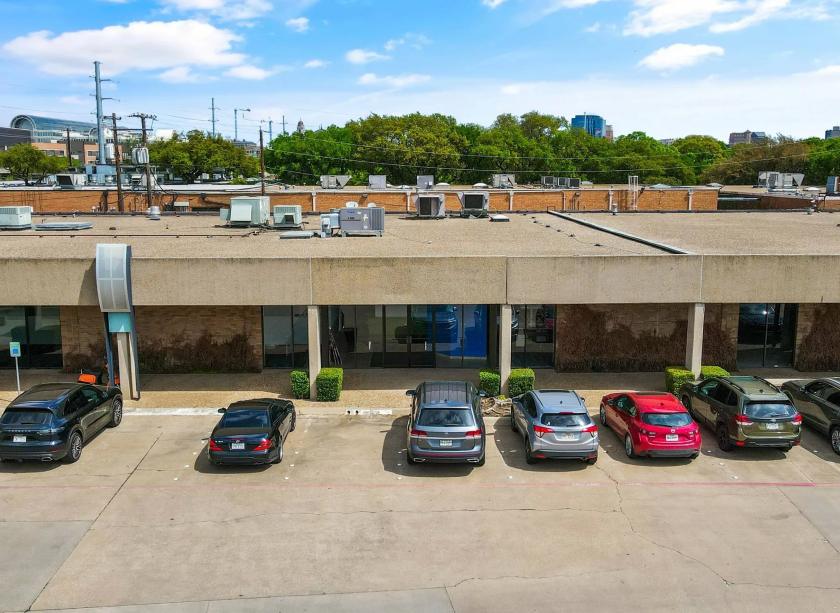
- • Ample Parking
- • Store Front Windows
- • Recently updated suite
Listing Agents

Jim Kelley
O: 817-488-4333
M: 817-909-7875
jim@championsdfw.com
O: 817-488-4333
M: 817-909-7875
jim@championsdfw.com

Lacy MilaniIngalls
O: 817-488-4333
lacy@championsdfw.com
O: 817-488-4333
lacy@championsdfw.com
While we strive to provide the most accurate information, all listing information, and demographic data, is provided by third-parties. As such, MyEListing will not be responsible for the accuracy of the information. It is strongly recommended that you verify all information with the listing agent, and any relevant agencies, prior to making any decisions.