Retail Space
5002 Columbia Avenue Dallas, TX 75214
5002 Columbia Avenue Dallas, TX 75214
Details & Description
Property Highlights
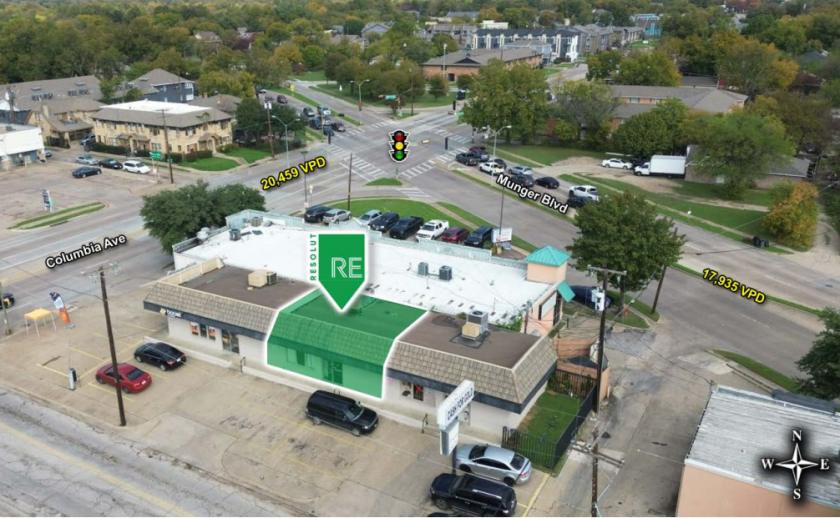
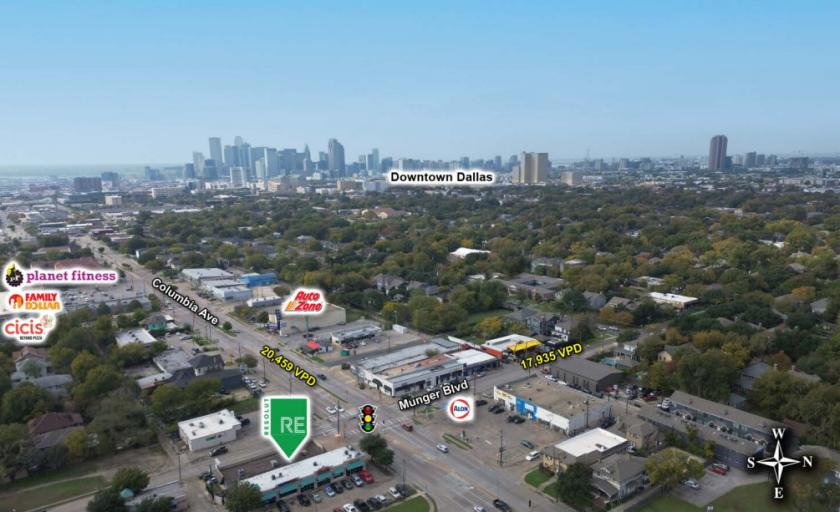
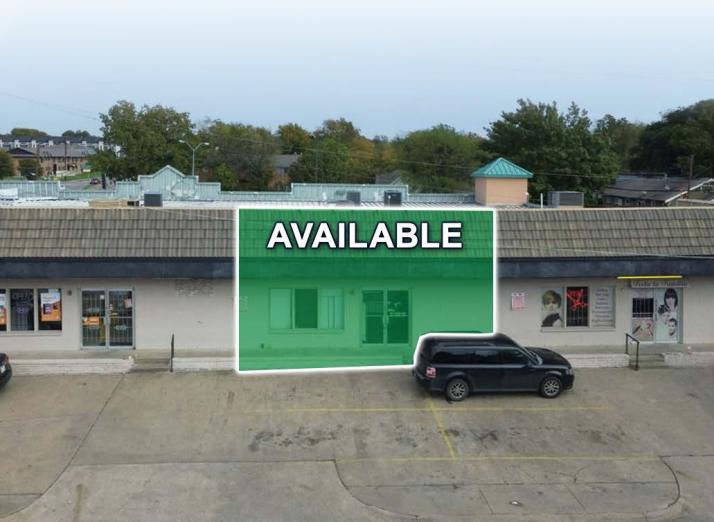
• Situated at 5002 Columbia Avenue in the vibrant Dallas area, offering excellent visibility and accessibility
• The vicinity hosts a diverse range of retail establishments, from boutique shops to larger chain stores
Listing Agents

Connor Coughlin
O: 469-563-6020
ccoughlin@resolutre.com
O: 469-563-6020
ccoughlin@resolutre.com
While we strive to provide the most accurate information, all listing information, and demographic data, is provided by third-parties. As such, MyEListing will not be responsible for the accuracy of the information. It is strongly recommended that you verify all information with the listing agent, and any relevant agencies, prior to making any decisions.