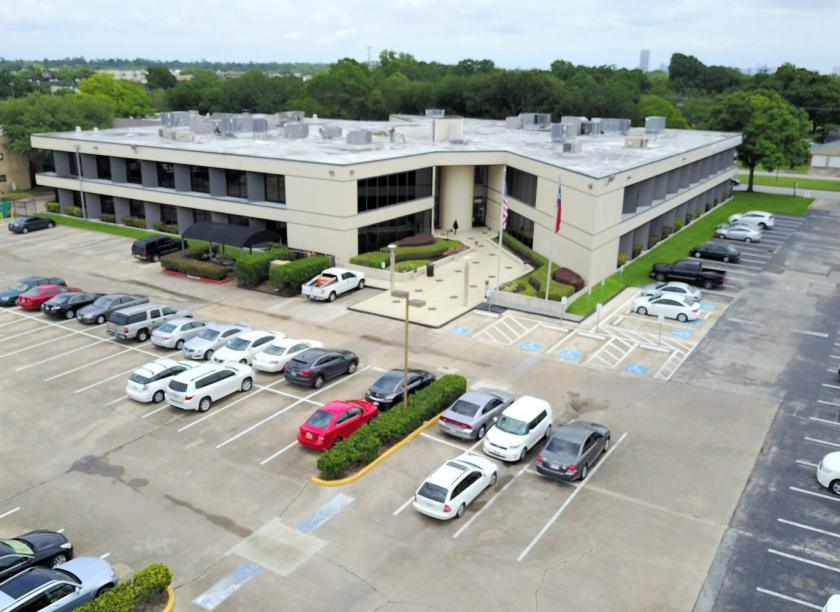
Office Space
2950 South Gessner Road Houston, TX 77063
2950 South Gessner Road Houston, TX 77063
Details & Description
Property Highlights
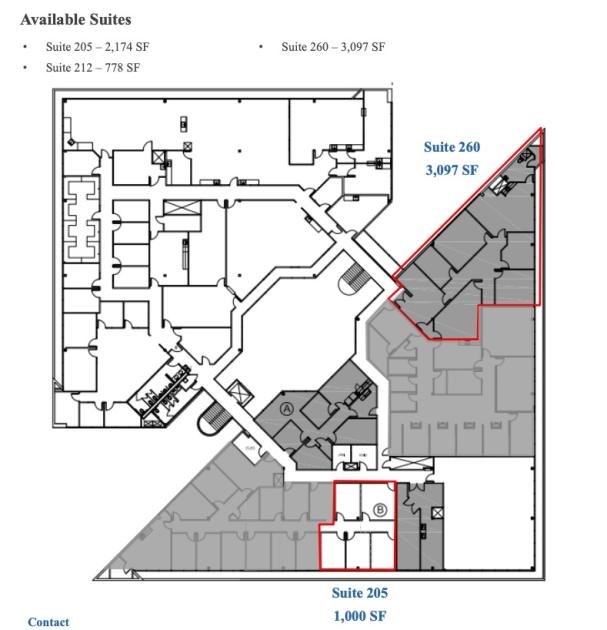
- • ±778 SF to ±3,097 SF Available
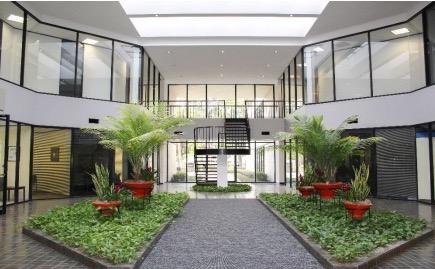
- • Renovated 61,049 SF Atrium Office Building
- • Second Generation Medical Lab Spaces Available
- • Parking Ratio: 5/1,000 RSF
- • Aggressive Rental Rates for Westchase Submarket
- • Negotiable Space Improvements
Additional Photos

Listing Agents

William Alcorn
O: 713-814-3798
william.alcorn@finialgroup.com
O: 713-814-3798
william.alcorn@finialgroup.com
While we strive to provide the most accurate information, all listing information, and demographic data, is provided by third-parties. As such, MyEListing will not be responsible for the accuracy of the information. It is strongly recommended that you verify all information with the listing agent, and any relevant agencies, prior to making any decisions.


