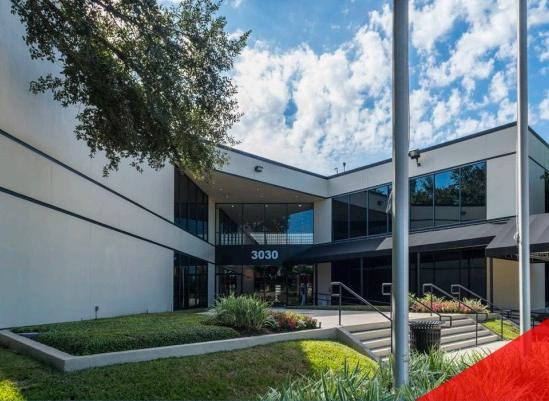
Office Space
3030 South Gessner Road Houston, TX 77063
3030 South Gessner Road Houston, TX 77063
Details & Description
Property Highlights
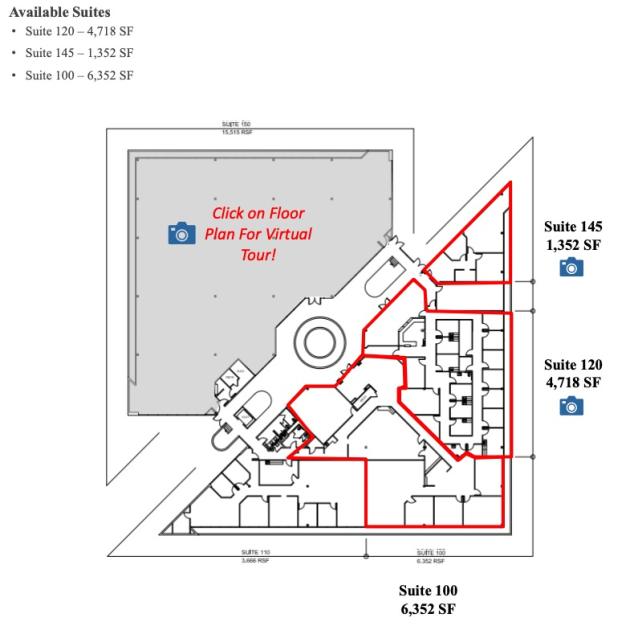
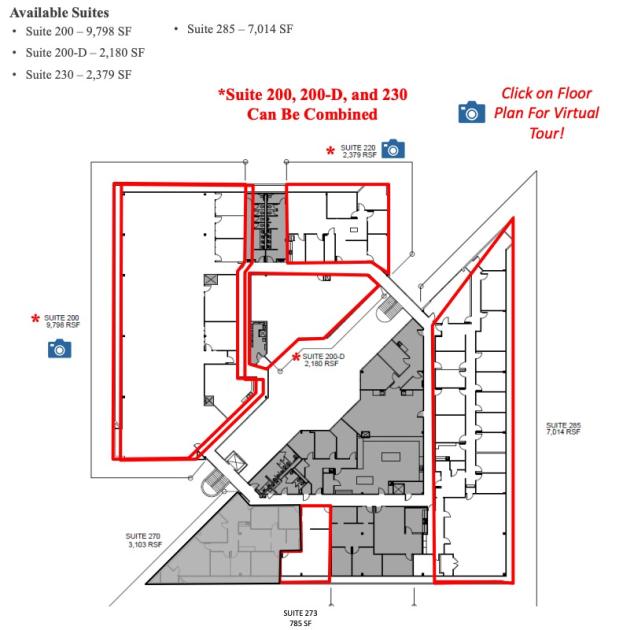
- • Suite Ranges: 785 – 15,000 SF
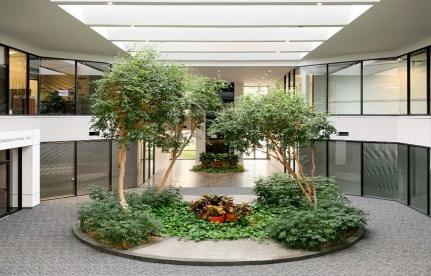
- • Renovated + 62,025 SF Atrium Office Building
- • Covered Drop Off
- • Tenant Improvement Available
- • Spaces Can Be Demised
Additional Photos

Listing Agents

William Alcorn
O: 713-814-3798
william.alcorn@finialgroup.com
O: 713-814-3798
william.alcorn@finialgroup.com
While we strive to provide the most accurate information, all listing information, and demographic data, is provided by third-parties. As such, MyEListing will not be responsible for the accuracy of the information. It is strongly recommended that you verify all information with the listing agent, and any relevant agencies, prior to making any decisions.


