Industrial Properties
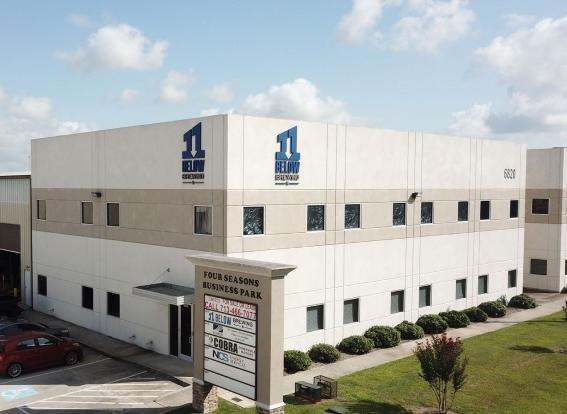
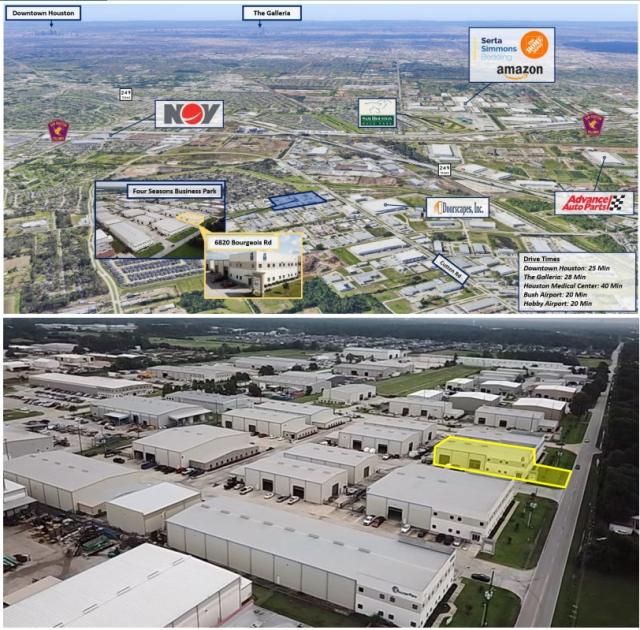
6820 Bourgeois Road Houston, TX 77066
6820 Bourgeois Road Houston, TX 77066
Details & Description
Property Highlights
- • Available February 1, 2024
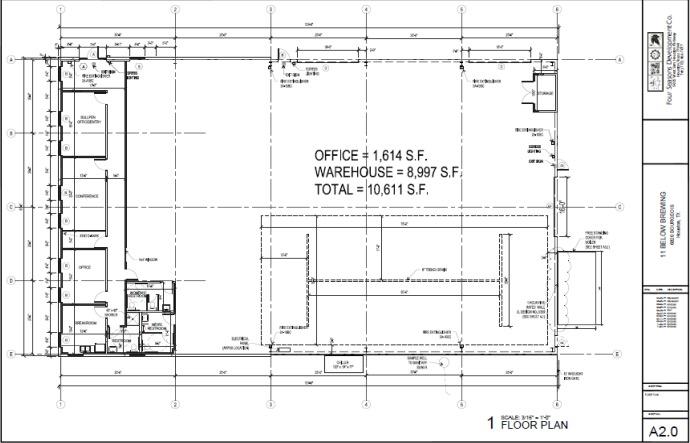
- • Free Span Metal Building with Tilt Wall Facade
- • 18’ Clear Height
- • 3 Phase 480V 400 AMPS
- • Building and Monument Signage Available
Additional Photos
Listing Agents

Jack Gaffney
Finial Group
O: 713-422-2100
jack.gaffney@finialgroup.com
Finial Group
O: 713-422-2100
jack.gaffney@finialgroup.com

John Buckley
Finial Group
O: 713-422-2100
john.buckley@finialgroup.com
Finial Group
O: 713-422-2100
john.buckley@finialgroup.com
While we strive to provide the most accurate information, all listing information, and demographic data, is provided by third-parties. As such, MyEListing will not be responsible for the accuracy of the information. It is strongly recommended that you verify all information with the listing agent, and any relevant agencies, prior to making any decisions.


