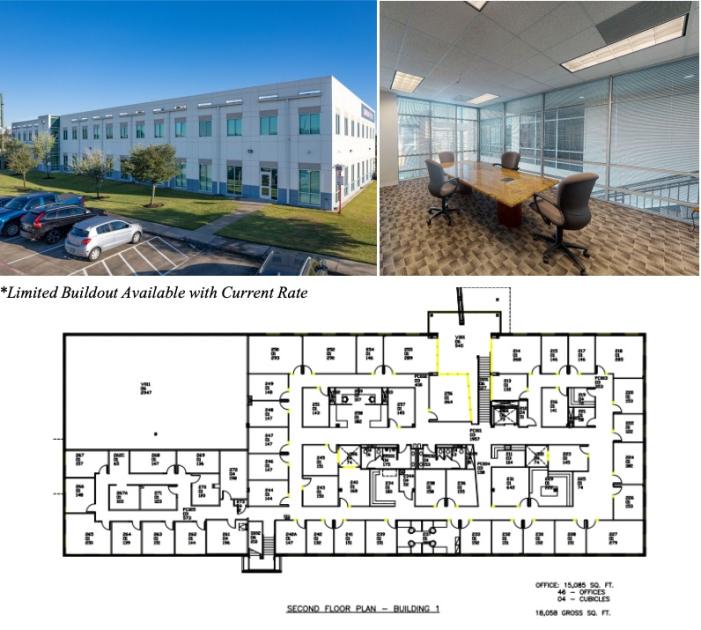
Office Space
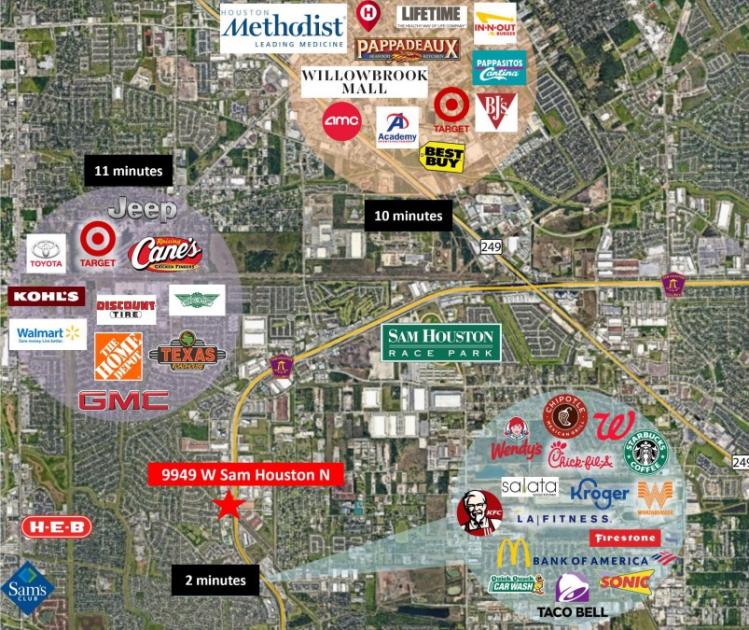
9949 West Sam Houston Parkway North Houston, TX 77064
9949 West Sam Houston Parkway North Houston, TX 77064
Details & Description
Property Highlights
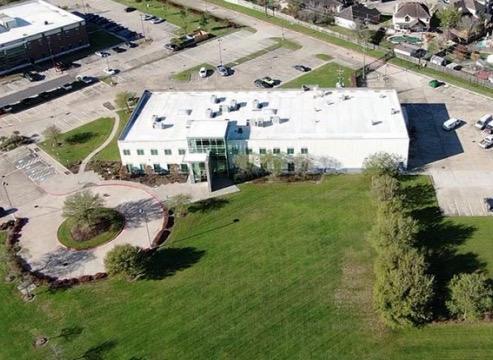
- • Sits on ±6.01 Acres of Land
- • Direct Access to Beltway 8 and Highway 290
- • Shorter Lease Terms Available
- • Heavy Power with Back Up Generator
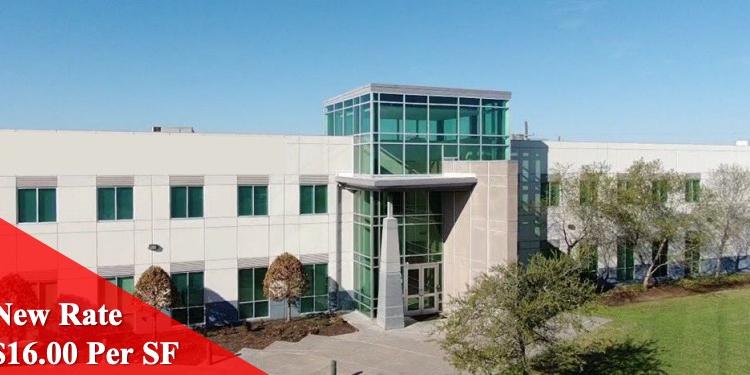
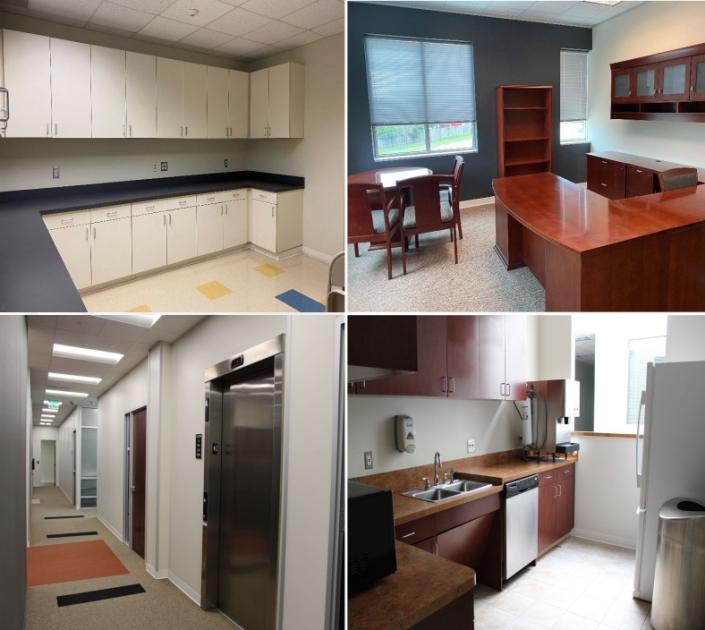
Additional Photos

Listing Agents

Jack Gaffney
Finial Group
O: 713-422-2100
jack.gaffney@finialgroup.com
Finial Group
O: 713-422-2100
jack.gaffney@finialgroup.com

John Buckley
Finial Group
O: 713-422-2100
john.buckley@finialgroup.com
Finial Group
O: 713-422-2100
john.buckley@finialgroup.com

Keith Bilski
M: 713-422-2090
keith.bilski@finialgroup.com
M: 713-422-2090
keith.bilski@finialgroup.com
While we strive to provide the most accurate information, all listing information, and demographic data, is provided by third-parties. As such, MyEListing will not be responsible for the accuracy of the information. It is strongly recommended that you verify all information with the listing agent, and any relevant agencies, prior to making any decisions.