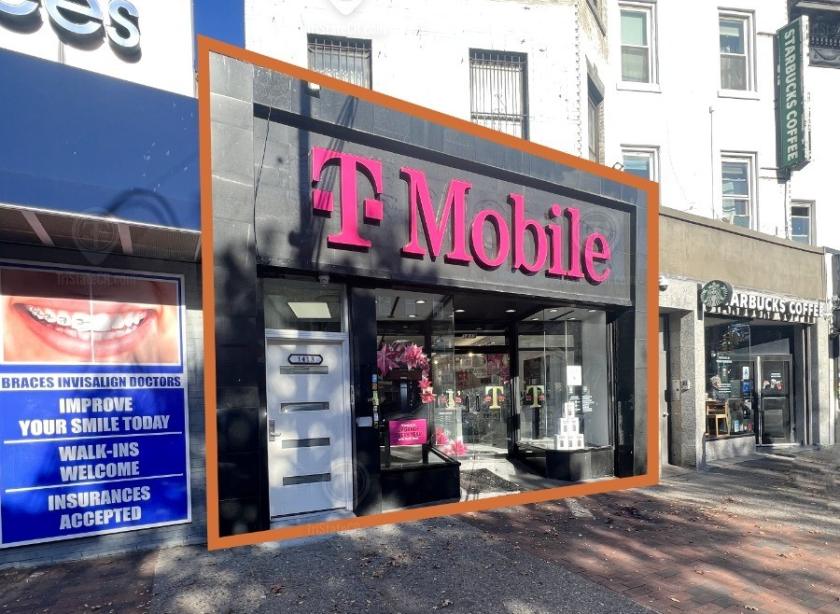
Retail Space
1413 Kings Highway Brooklyn, NY 11229
1413 Kings Highway Brooklyn, NY 11229
Details & Description
Property Highlights
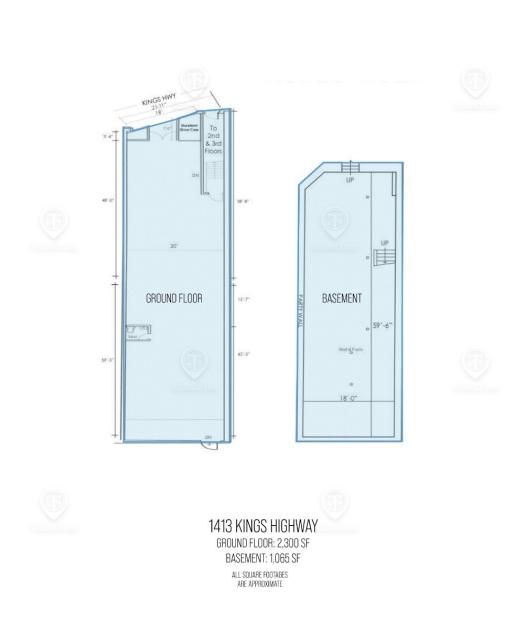
- • Basement
- • Glass frontage
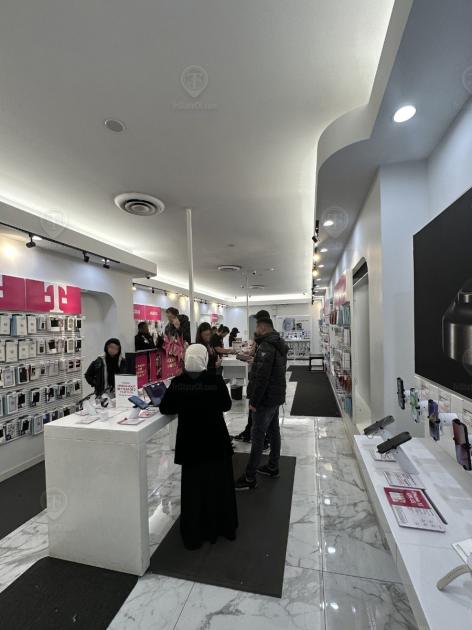
- • Surrounded by national tenants
- • Back room with 12+ foot ceilings for storage
- • Steps from the subway station
Additional Photos


Listing Agents

Shlomi Bagdadi
O: 718-437-6100
info@tristatecr.com
O: 718-437-6100
info@tristatecr.com
While we strive to provide the most accurate information, all listing information, and demographic data, is provided by third-parties. As such, MyEListing will not be responsible for the accuracy of the information. It is strongly recommended that you verify all information with the listing agent, and any relevant agencies, prior to making any decisions.


