Commercial Land
5320-5324 Peachtree Rd Balch Springs, TX 75180
5320-5324 Peachtree Rd Balch Springs, TX 75180

Details & Description
Property Highlights
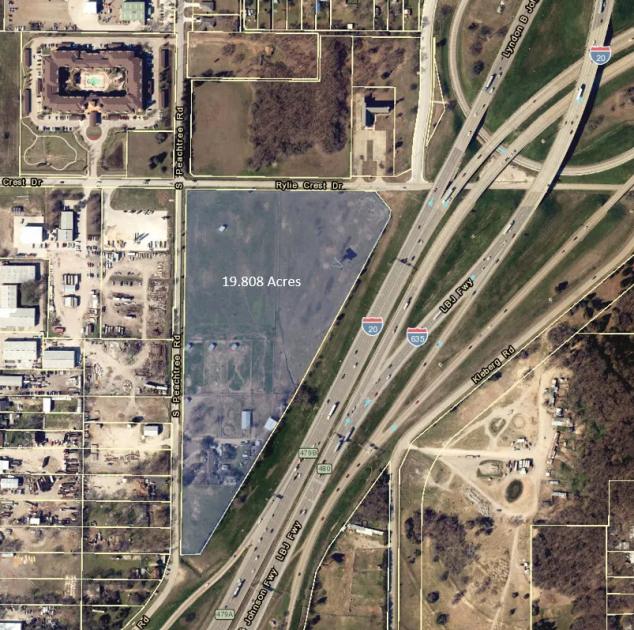
- • Highly Visible from IH-20
- • Zoned Industrial
- • Easy access to Highway 175, IH-20, and 635
- • 154,000 VPD--Billboard on site
- • Triple Freeport and other incentives available
- • Equidistant between Union Pacific Intermodals
Listing Agents

Michelle Hudson
O: 214-389-3663
M: 214-534-0226
Hudson@HudsonPeters.com
O: 214-389-3663
M: 214-534-0226
Hudson@HudsonPeters.com

Tom Hudson
Hudson Peters Commercial
O: 214-389-3667
M: 214-389-3667
tom@hudsonpeters.com
Hudson Peters Commercial
O: 214-389-3667
M: 214-389-3667
tom@hudsonpeters.com
While we strive to provide the most accurate information, all listing information, and demographic data, is provided by third-parties. As such, MyEListing will not be responsible for the accuracy of the information. It is strongly recommended that you verify all information with the listing agent, and any relevant agencies, prior to making any decisions.