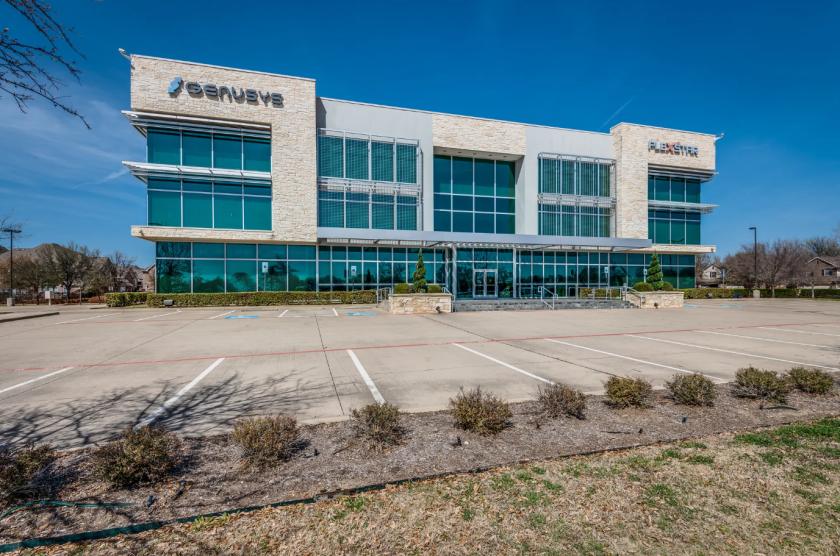
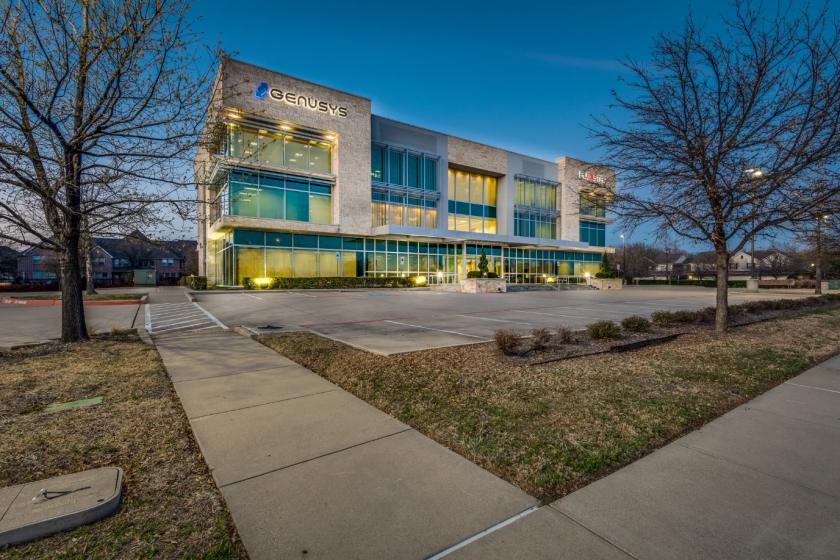
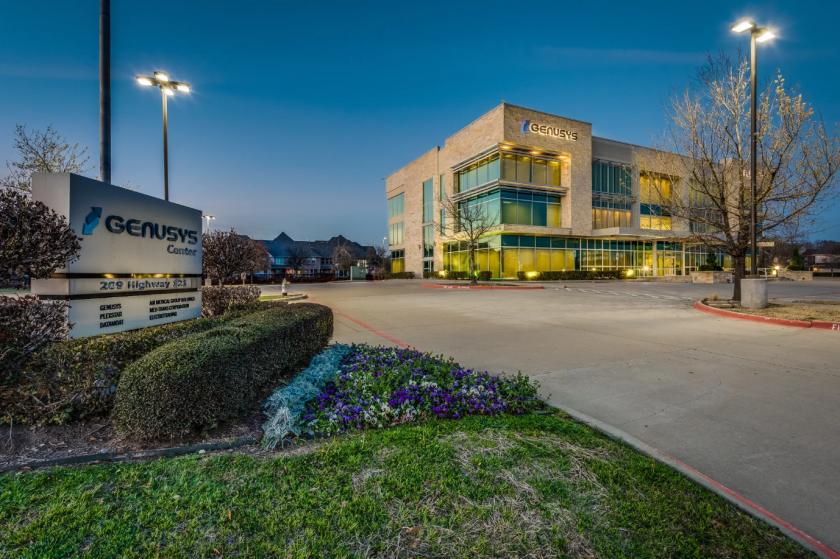
Office Space
209 State Highway 121 Bypass Lewisville, TX 75067
209 State Highway 121 Bypass Lewisville, TX 75067
Details & Description
Property Highlights
- • Sublease Opportunity
- • 1,500 SF Available
- • 24/7 card key building access
- • Dual fiber access providers - High speed internet
- • Short term or up to 4 years available
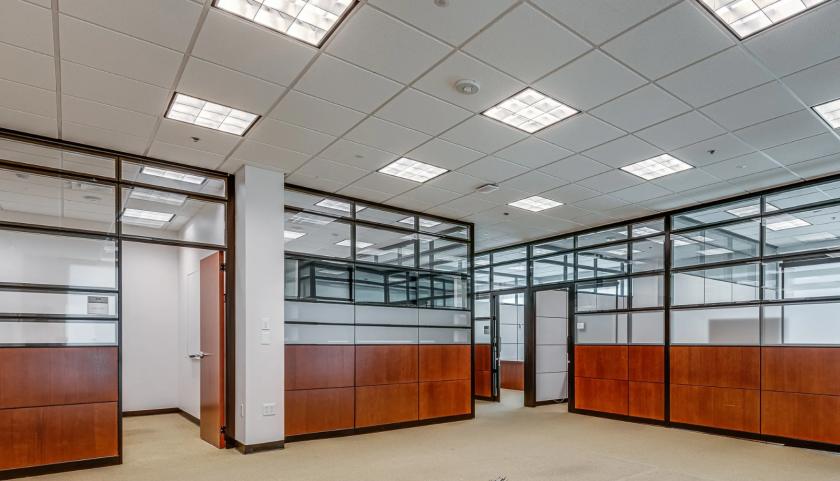
- • Full height glass with ample natural light
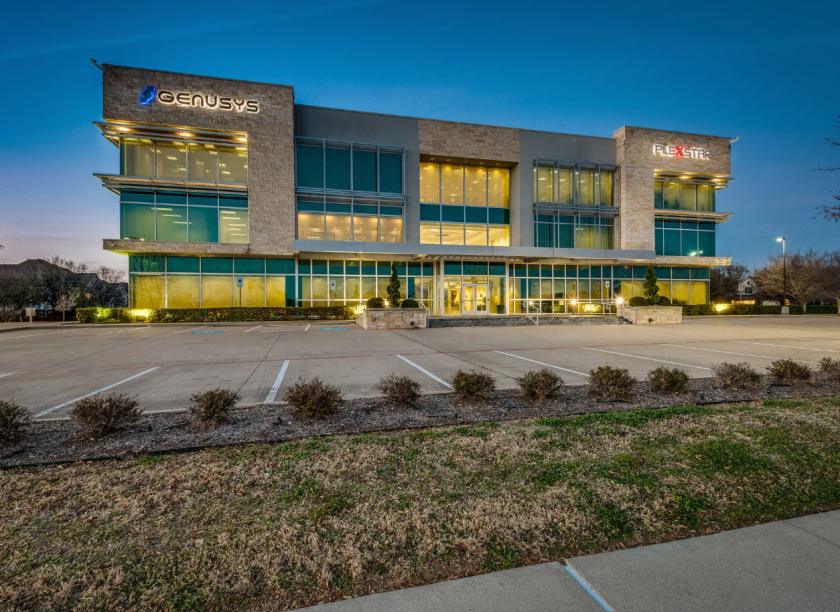
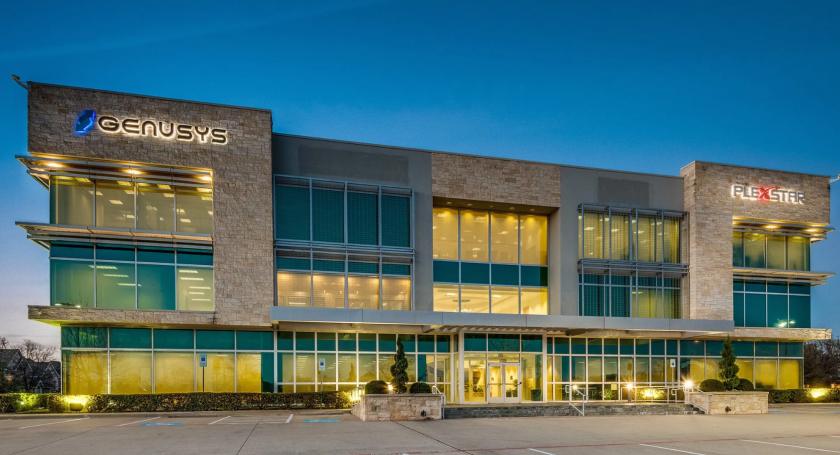
Additional Photos
Listing Agents

Michelle Hudson
O: 214-389-3663
M: 214-534-0226
Hudson@HudsonPeters.com
O: 214-389-3663
M: 214-534-0226
Hudson@HudsonPeters.com

Tom Hudson
Hudson Peters Commercial
O: 214-389-3667
M: 214-389-3667
tom@hudsonpeters.com
Hudson Peters Commercial
O: 214-389-3667
M: 214-389-3667
tom@hudsonpeters.com
While we strive to provide the most accurate information, all listing information, and demographic data, is provided by third-parties. As such, MyEListing will not be responsible for the accuracy of the information. It is strongly recommended that you verify all information with the listing agent, and any relevant agencies, prior to making any decisions.