Multifamily Housing
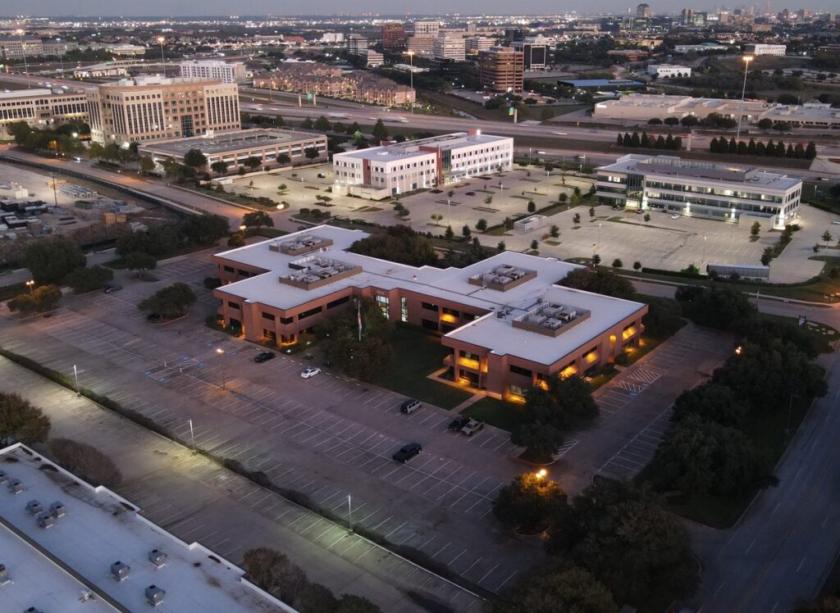
5800 Campus Circle Drive East Irving, TX 75063
5800 Campus Circle Drive East Irving, TX 75063
Details & Description
Property Highlights
- • Year built: 1982
- • Multifamily Redevelopment Opportunity
- • Well Maintained - High Finish Out Class B+ Office
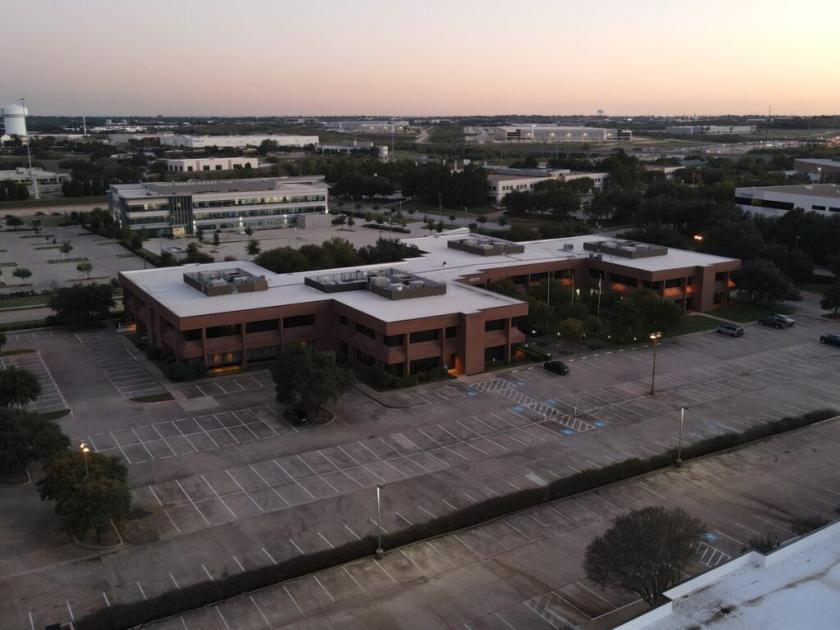
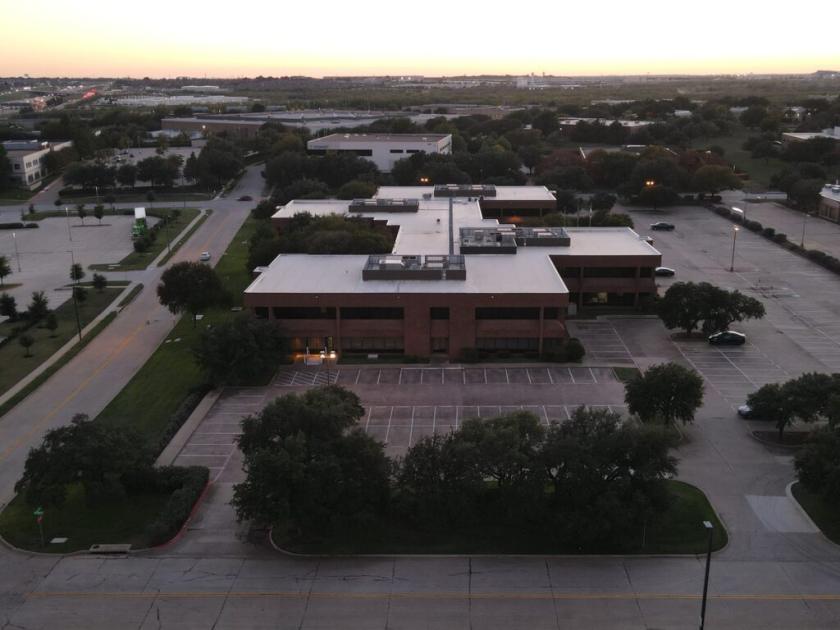
Additional Photos


Listing Agents

David Fersing
O: 972-755-5151
david.fersing@marcusmillichap.com
O: 972-755-5151
david.fersing@marcusmillichap.com

Nick Fluellen
Marcus & Millichap Fluellen-Ho
O: 972-755-5214
nick.fluellen@marcusmillichap.com
Marcus & Millichap Fluellen-Ho
O: 972-755-5214
nick.fluellen@marcusmillichap.com

Bard Hoover
Marcus & Millichap Fluellen-Ho
O: 972-755-5216
bard.hoover@marcusmillichap.com
Marcus & Millichap Fluellen-Ho
O: 972-755-5216
bard.hoover@marcusmillichap.com
While we strive to provide the most accurate information, all listing information, and demographic data, is provided by third-parties. As such, MyEListing will not be responsible for the accuracy of the information. It is strongly recommended that you verify all information with the listing agent, and any relevant agencies, prior to making any decisions.


