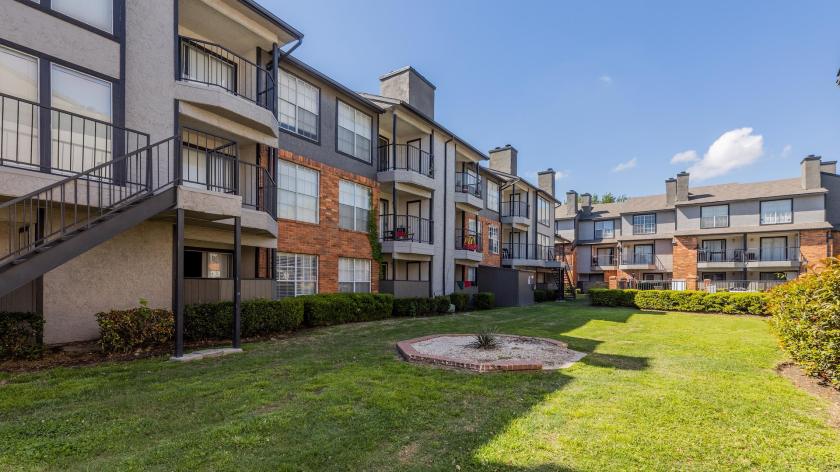
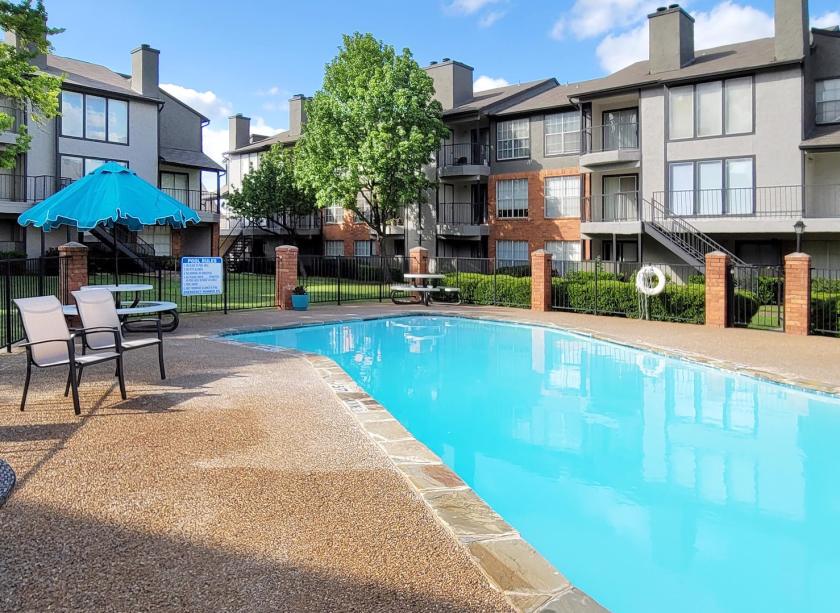
1-Mile | 3-Miles | 5-Miles | ||
---|---|---|---|---|
Total Population | 16,937 | 88,904 | 249,205 | |
Population Median Age | 31 | 36 | 36 | |
Population by Age | 0-9 Yrs | 3505 (20%) | 13954 (15%) | 38041 (15%) |
10-19 Yrs | 2341 (13%) | 12909 (14%) | 38723 (15%) | |
20-29 Yrs | 3079 (18%) | 11718 (13%) | 34139 (13%) | |
30-39 Yrs | 2723 (16%) | 12781 (14%) | 33143 (13%) | |
40-49 Yrs | 1555 (9%) | 9286 (10%) | 29654 (11%) | |
50-59 Yrs | 1715 (10%) | 10785 (12%) | 29289 (11%) | |
60-69 Yrs | 1155 (6%) | 9030 (10%) | 24834 (9%) | |
70+ Yrs | 865 (5%) | 8442 (9%) | 21382 (8%) | |
Median HH Income | $32,554 | $43,695 | $49,614 | |
Total Household Income | < 24K | 2881 (39%) | 8823 (26%) | 19615 (23%) |
25-49K | 2588 (35%) | 9709 (29%) | 23088 (27%) | |
50-74K | 956 (13%) | 5708 (17%) | 16489 (19%) | |
75-99K | 370 (5%) | 3537 (10%) | 9776 (11%) | |
100-199K | 424 (5%) | 4261 (13%) | 13631 (16%) | |
200K+ | 65 (0%) | 675 (2%) | 2219 (2%) | |
Highest Education Level | No Diploma | 1649 | 10294 | 31616 |
Diploma or GED | 3436 | 17208 | 44839 | |
Some College | 3091 | 14936 | 38838 | |
Assoc. Degree | 507 | 3513 | 9041 | |
Bachelors Degree | 772 | 6297 | 19681 | |
Higher Degree | 392 | 4173 | 11363 | |
Total Housing Units | 8,143 | 35,252 | 90,390 | |
--Owner-Occupied | 980 | 14,816 | 45,454 | |
--Renter-Occupied | 6,305 | 17,896 | 39,364 | |
Owner-Occupied Values | < 100K | 112 | 2638 | 8886 |
100-199K | 725 | 8608 | 22970 | |
200-299K | 108 | 2403 | 9735 | |
300-399K | 10 | 543 | 2384 | |
400-499K | 4 | 327 | 803 | |
500K+ | 21 | 298 | 676 | |
Total Working Age Population | 11,844 | 66,876 | 187,829 | |
In Work Force | 8,143 | 41,098 | 117,208 | |
Not In Work Force | 3,701 | 25,778 | 70,622 | |
Workforce Employed | 7,613 | 37,763 | 109,314 | |
Workforce Unemployed | 511 | 3,316 | 7,781 | |
Civlian Workforce | 8,124 | 41,079 | 117,095 | |
Military Workforce | 19 | 19 | 112 | |
Total Households | 7,285 | 32,712 | 84,818 | |
Family Households | 3,427 | 20,757 | 58,066 | |
Non-Family Households | 3,859 | 11,955 | 26,752 | |
Married Couple | 998 | 10,469 | 32,581 | |
Other Family | 2,429 | 10,289 | 25,485 | |
Married w/Child | 475 | 3,678 | 12,509 | |
Single Male w/Child | 315 | 959 | 2,499 | |
Single Female w/Child | 1,468 | 4,792 | 10,896 |
Population Change Last Two Decades - Plus Projection
2000 | % | 2010 | % | 2020 | % | 2030 | |
---|---|---|---|---|---|---|---|
Texas | 20,851,820 | +21 | 25,145,561 | +18 | 29,677,668 | +18 | 34,894,452 |
Dallas County | 2,218,899 | +7 | 2,368,139 | +15 | 2,734,111 | +14 | 3,106,298 |
Total Working Age Population:
Total Households:
Total Working Age Population:
Total Households:
Total Working Age Population:
Total Households: