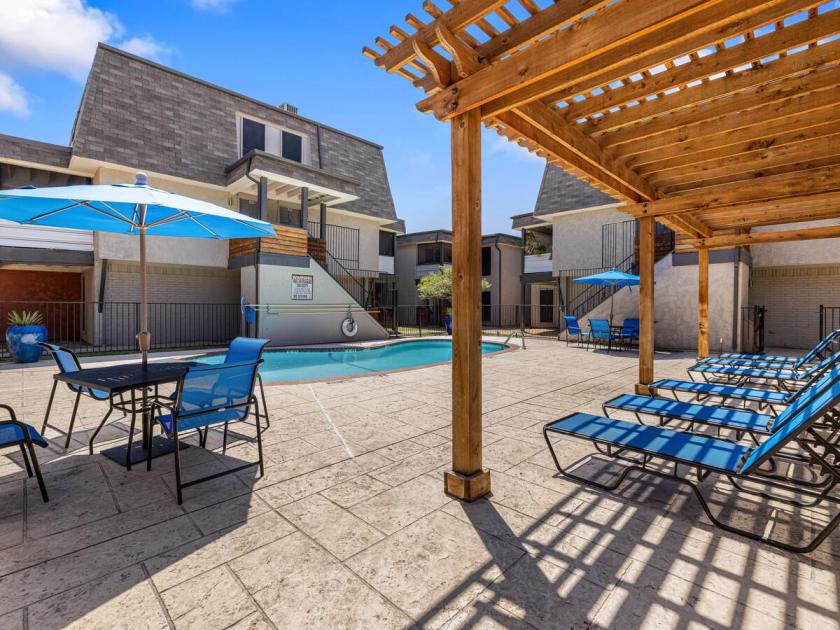
1-Mile | 3-Miles | 5-Miles | ||
---|---|---|---|---|
Total Population | 19,689 | 145,016 | 220,083 | |
Population Median Age | 34 | 34 | 33 | |
Population by Age | 0-9 Yrs | 3417 (17%) | 23068 (15%) | 35192 (15%) |
10-19 Yrs | 3043 (15%) | 22929 (15%) | 30787 (13%) | |
20-29 Yrs | 2973 (15%) | 21877 (15%) | 37182 (16%) | |
30-39 Yrs | 2518 (12%) | 20698 (14%) | 36195 (16%) | |
40-49 Yrs | 2738 (13%) | 20109 (13%) | 30260 (13%) | |
50-59 Yrs | 2044 (10%) | 16020 (11%) | 23161 (10%) | |
60-69 Yrs | 1750 (8%) | 11280 (7%) | 15374 (6%) | |
70+ Yrs | 1207 (6%) | 9036 (6%) | 11932 (5%) | |
Median HH Income | $55,918 | $56,788 | $60,126 | |
Total Household Income | < 24K | 1027 (17%) | 7010 (15%) | 11041 (14%) |
25-49K | 1551 (26%) | 13004 (28%) | 19614 (25%) | |
50-74K | 1180 (20%) | 9740 (21%) | 16912 (22%) | |
75-99K | 765 (13%) | 6094 (13%) | 10619 (13%) | |
100-199K | 1099 (19%) | 8201 (17%) | 14682 (19%) | |
200K+ | 160 (2%) | 1671 (3%) | 3000 (3%) | |
Highest Education Level | No Diploma | 4287 | 27891 | 34665 |
Diploma or GED | 2821 | 22135 | 31632 | |
Some College | 2151 | 14594 | 23856 | |
Assoc. Degree | 494 | 5166 | 8526 | |
Bachelors Degree | 1373 | 13188 | 26240 | |
Higher Degree | 619 | 5510 | 12751 | |
Total Housing Units | 6,237 | 48,728 | 81,778 | |
--Owner-Occupied | 3,068 | 22,565 | 29,882 | |
--Renter-Occupied | 2,715 | 23,155 | 45,986 | |
Owner-Occupied Values | < 100K | 444 | 3667 | 5809 |
100-199K | 1807 | 11733 | 13899 | |
200-299K | 525 | 4572 | 6060 | |
300-399K | 222 | 1592 | 2112 | |
400-499K | 57 | 535 | 970 | |
500K+ | 14 | 465 | 1033 | |
Total Working Age Population | 14,237 | 108,012 | 166,655 | |
In Work Force | 9,905 | 76,672 | 120,904 | |
Not In Work Force | 4,331 | 31,340 | 45,751 | |
Workforce Employed | 9,441 | 72,936 | 115,369 | |
Workforce Unemployed | 464 | 3,737 | 5,488 | |
Civlian Workforce | 9,905 | 76,672 | 120,857 | |
Military Workforce | 0 | 0 | 47 | |
Total Households | 5,783 | 45,720 | 75,868 | |
Family Households | 4,580 | 33,504 | 50,818 | |
Non-Family Households | 1,203 | 12,217 | 25,050 | |
Married Couple | 2,666 | 21,978 | 33,788 | |
Other Family | 1,914 | 11,526 | 17,031 | |
Married w/Child | 1,342 | 11,159 | 16,611 | |
Single Male w/Child | 266 | 1,507 | 2,428 | |
Single Female w/Child | 694 | 4,318 | 6,405 |
Population Change Last Two Decades - Plus Projection
2000 | % | 2010 | % | 2020 | % | 2030 | |
---|---|---|---|---|---|---|---|
Texas | 20,851,820 | +21 | 25,145,561 | +18 | 29,677,668 | +18 | 34,894,452 |
Tarrant County | 1,446,219 | +25 | 1,809,034 | +19 | 2,143,755 | +17 | 2,507,170 |
Dallas County | 2,218,899 | +7 | 2,368,139 | +15 | 2,734,111 | +14 | 3,106,298 |
Total Working Age Population:
Total Households:
Total Working Age Population:
Total Households:
Total Working Age Population:
Total Households: