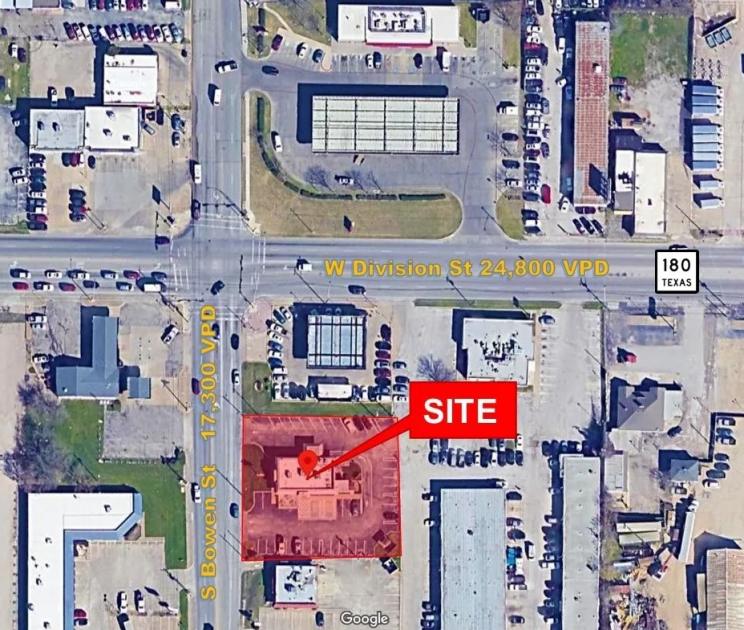
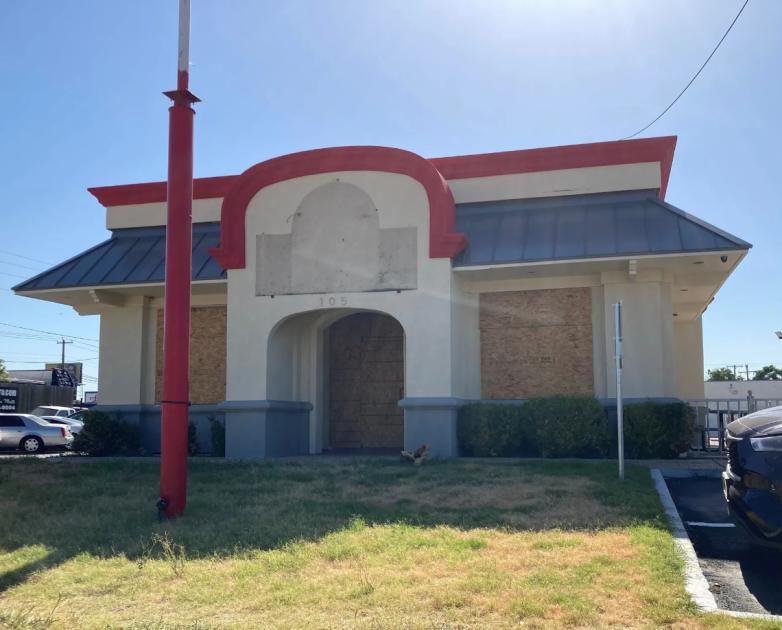
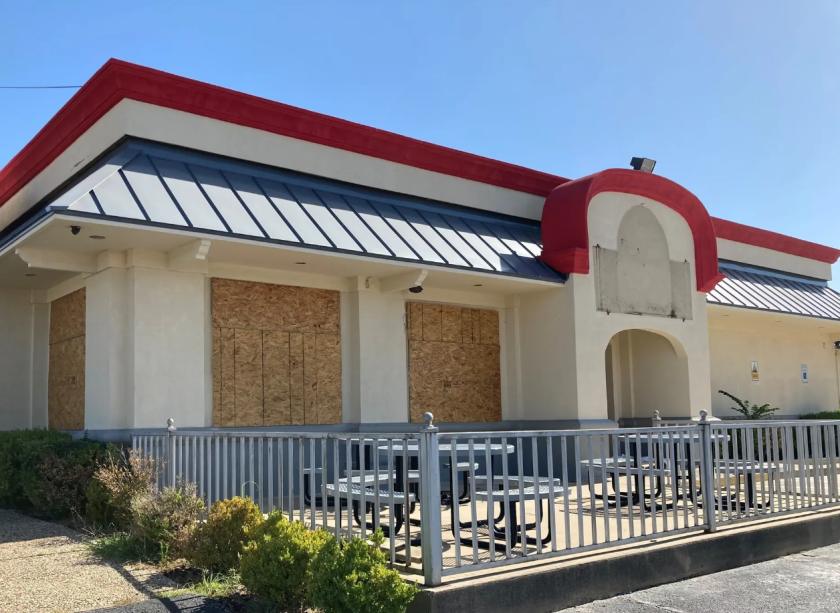
1-Mile | 3-Miles | 5-Miles | ||
---|---|---|---|---|
Total Population | 15,279 | 103,114 | 271,740 | |
Population Median Age | 36 | 37 | 36 | |
Population by Age | 0-9 Yrs | 2246 (14%) | 12809 (12%) | 37212 (13%) |
10-19 Yrs | 2049 (13%) | 14095 (13%) | 38259 (14%) | |
20-29 Yrs | 2294 (15%) | 18312 (17%) | 46057 (16%) | |
30-39 Yrs | 2236 (14%) | 13495 (13%) | 37384 (13%) | |
40-49 Yrs | 1940 (12%) | 12795 (12%) | 34758 (12%) | |
50-59 Yrs | 1687 (11%) | 11703 (11%) | 30712 (11%) | |
60-69 Yrs | 1150 (7%) | 9702 (9%) | 25561 (9%) | |
70+ Yrs | 1678 (10%) | 10202 (9%) | 21797 (8%) | |
Median HH Income | $58,915 | $57,417 | $57,409 | |
Total Household Income | < 24K | 1191 (20%) | 8041 (21%) | 19470 (19%) |
25-49K | 1302 (22%) | 8827 (23%) | 24156 (24%) | |
50-74K | 1393 (23%) | 6702 (17%) | 18923 (19%) | |
75-99K | 722 (12%) | 4201 (11%) | 12150 (12%) | |
100-199K | 1082 (18%) | 8162 (21%) | 19794 (20%) | |
200K+ | 225 (3%) | 2195 (5%) | 4450 (4%) | |
Highest Education Level | No Diploma | 753 | 7842 | 27070 |
Diploma or GED | 2500 | 15397 | 42317 | |
Some College | 2088 | 16174 | 41020 | |
Assoc. Degree | 728 | 4845 | 12722 | |
Bachelors Degree | 2703 | 14578 | 34448 | |
Higher Degree | 831 | 7796 | 17214 | |
Total Housing Units | 6,483 | 42,043 | 109,599 | |
--Owner-Occupied | 2,752 | 18,641 | 49,860 | |
--Renter-Occupied | 3,162 | 19,487 | 49,083 | |
Owner-Occupied Values | < 100K | 348 | 2018 | 7859 |
100-199K | 1183 | 7465 | 21411 | |
200-299K | 988 | 6512 | 14283 | |
300-399K | 165 | 1779 | 4016 | |
400-499K | 41 | 529 | 1330 | |
500K+ | 27 | 339 | 961 | |
Total Working Age Population | 11,678 | 82,436 | 212,311 | |
In Work Force | 7,813 | 54,728 | 144,179 | |
Not In Work Force | 3,865 | 27,708 | 68,133 | |
Workforce Employed | 7,414 | 51,589 | 136,237 | |
Workforce Unemployed | 399 | 3,045 | 7,741 | |
Civlian Workforce | 7,813 | 54,634 | 143,979 | |
Military Workforce | 0 | 94 | 200 | |
Total Households | 5,914 | 38,128 | 98,943 | |
Family Households | 3,760 | 24,340 | 63,913 | |
Non-Family Households | 2,154 | 13,788 | 35,030 | |
Married Couple | 2,166 | 16,060 | 42,253 | |
Other Family | 1,594 | 8,280 | 21,660 | |
Married w/Child | 879 | 6,334 | 17,607 | |
Single Male w/Child | 215 | 912 | 2,431 | |
Single Female w/Child | 642 | 3,229 | 9,188 |
Population Change Last Two Decades - Plus Projection
2000 | % | 2010 | % | 2020 | % | 2030 | |
---|---|---|---|---|---|---|---|
Texas | 20,851,820 | +21 | 25,145,561 | +18 | 29,677,668 | +18 | 34,894,452 |
Tarrant County | 1,446,219 | +25 | 1,809,034 | +19 | 2,143,755 | +17 | 2,507,170 |
Total Working Age Population:
Total Households:
Total Working Age Population:
Total Households:
Total Working Age Population:
Total Households: