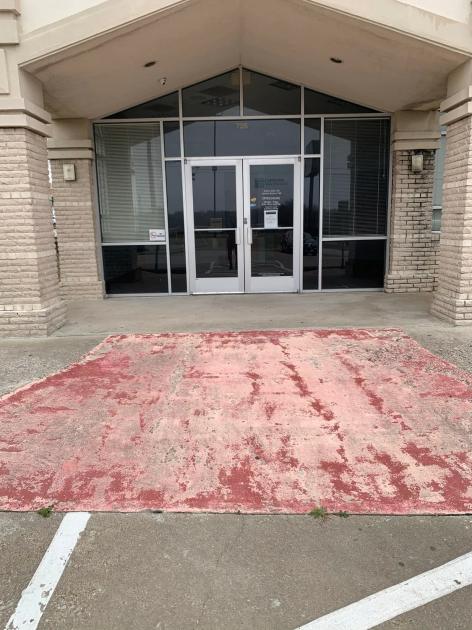
Office Space
726 S Cockrell Hill Duncanville, TX 75137
726 S Cockrell Hill Duncanville, TX 75137

Details & Description
Property Highlights
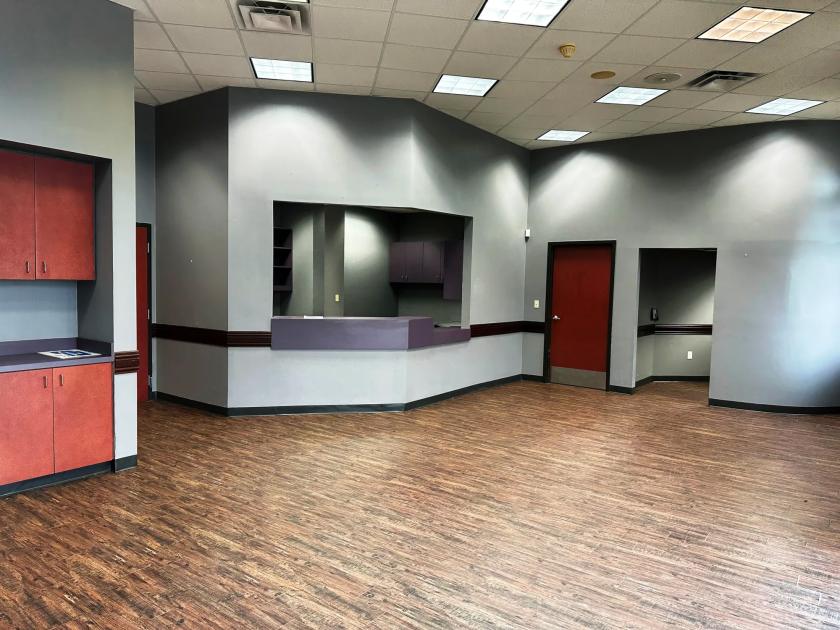
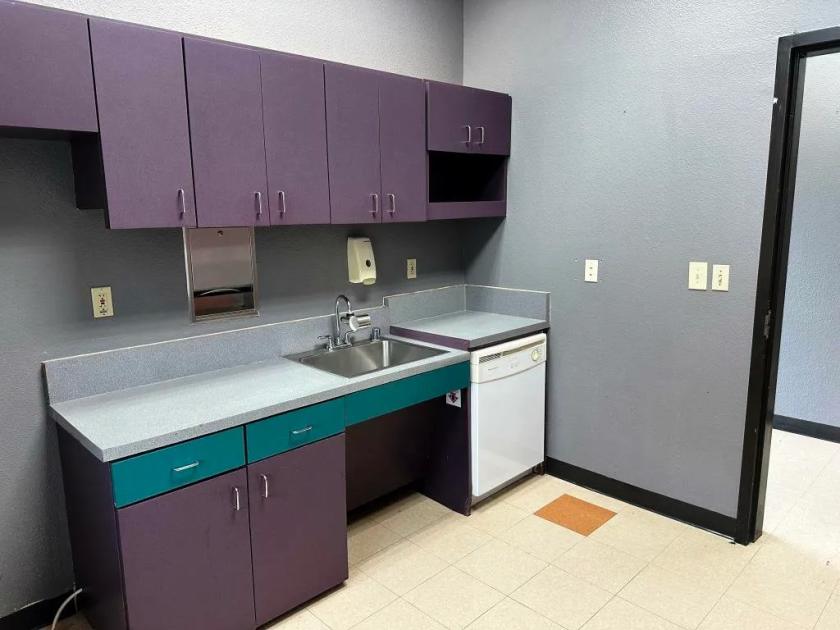
- • Medical Space - 6 Exams, Lab, X-Ray
- • Could be refit to retail/service use
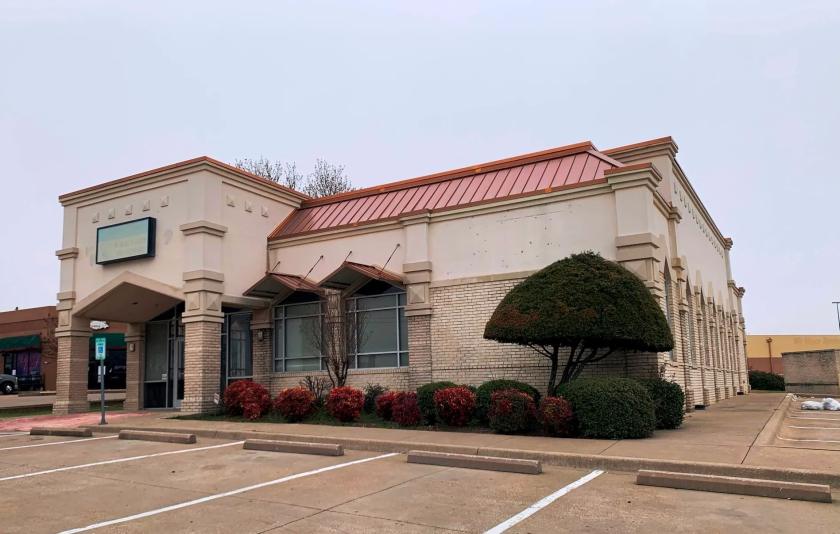
- • Nearby access to Hwy 67 & IH 20
- • 6:1000 Parking Ratio
Additional Photos


Listing Agents

Cincha Kostman
O: 214-389-3665
M: 214-212-1998
Kostman@HudsonPeters.com
O: 214-389-3665
M: 214-212-1998
Kostman@HudsonPeters.com
While we strive to provide the most accurate information, all listing information, and demographic data, is provided by third-parties. As such, MyEListing will not be responsible for the accuracy of the information. It is strongly recommended that you verify all information with the listing agent, and any relevant agencies, prior to making any decisions.