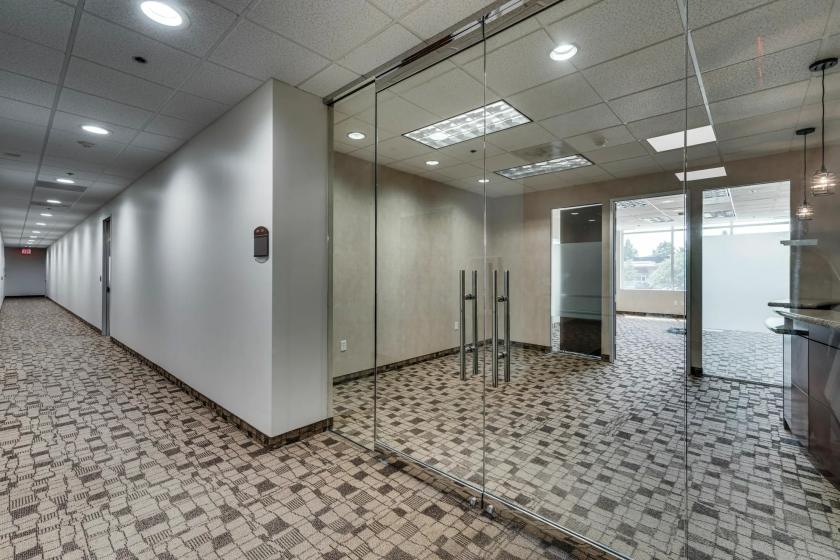
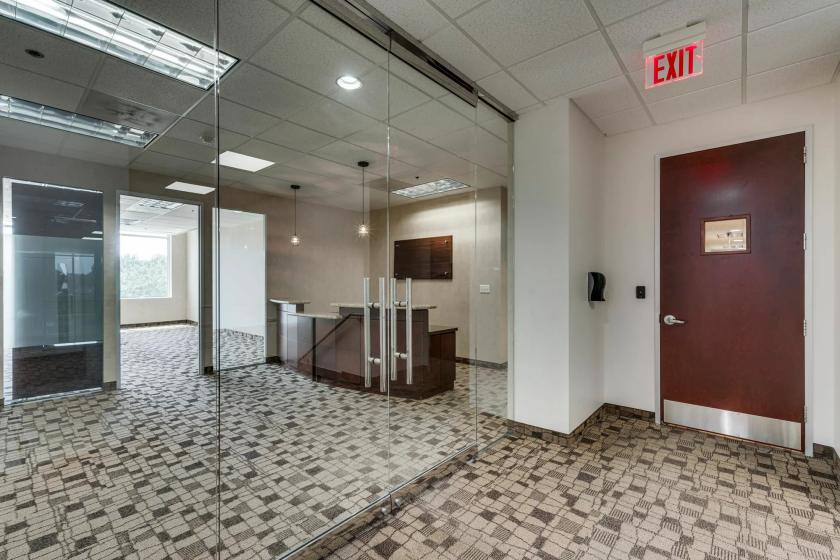
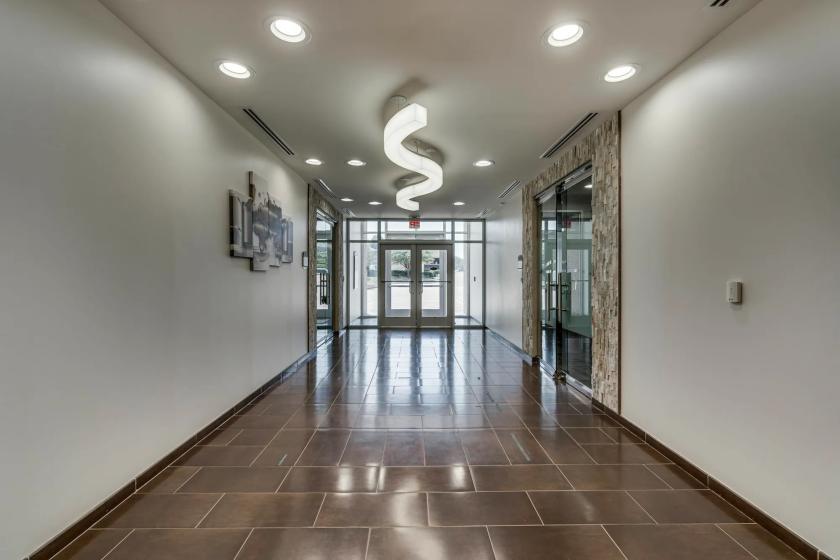
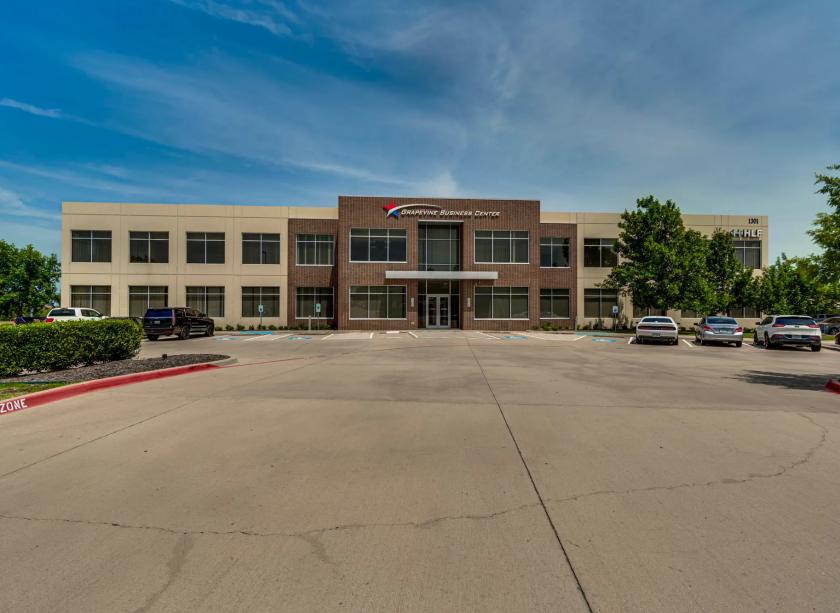
Office Space
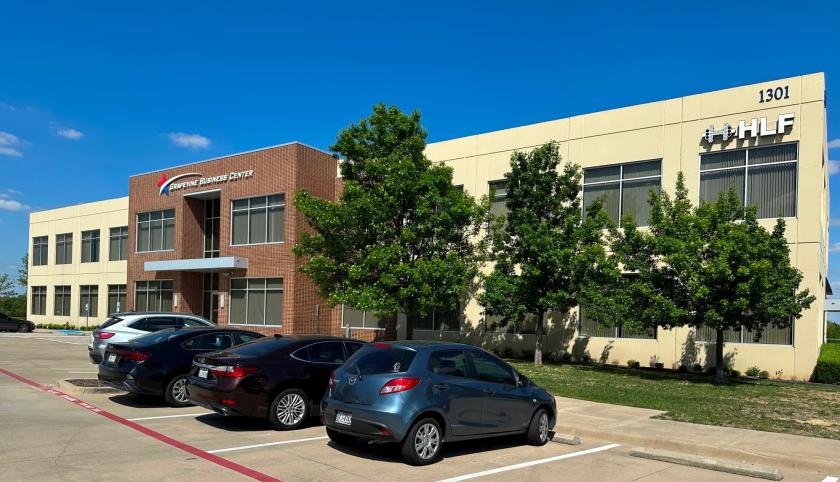
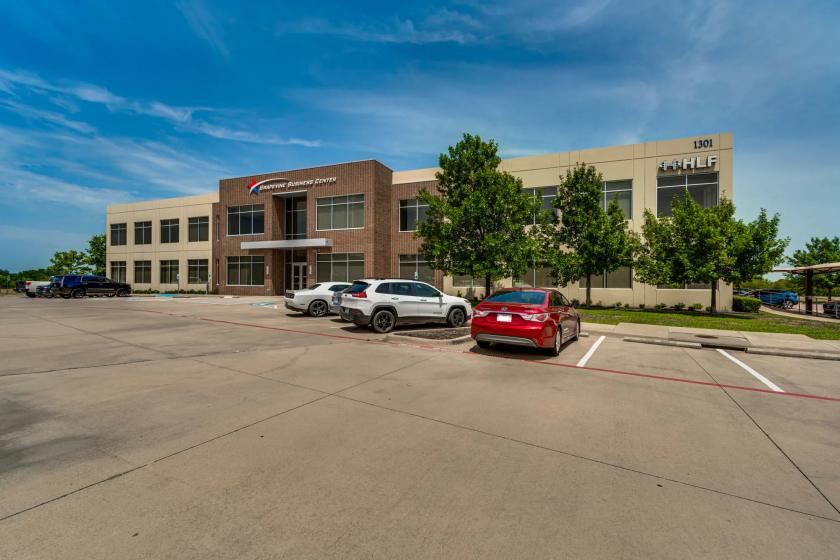
1301 Municipal Way Grapevine, TX 76051
1301 Municipal Way Grapevine, TX 76051
Details & Description
Property Highlights
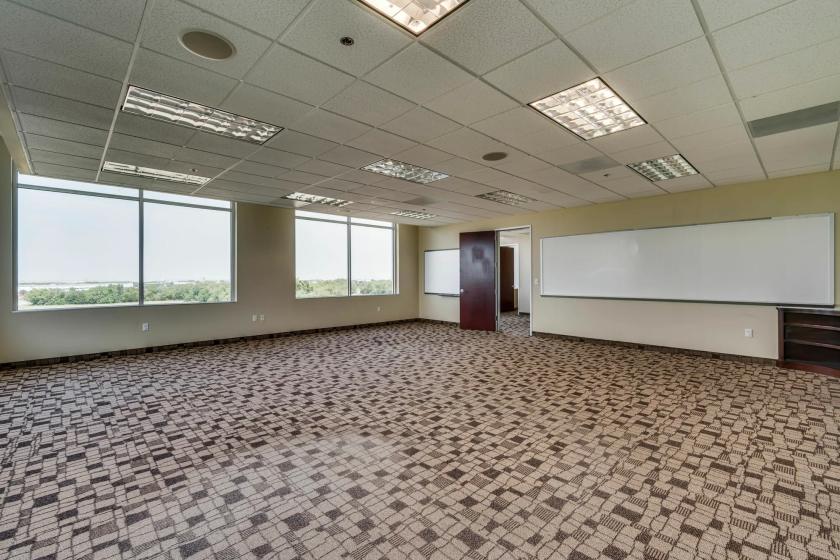
- • Suite 200 - 1,000-10,568 SF (Divisible)
- • Potential for 15,017 SF (Full 2nd Floor)
- • 3.2 parking spaces per 1,000 SF
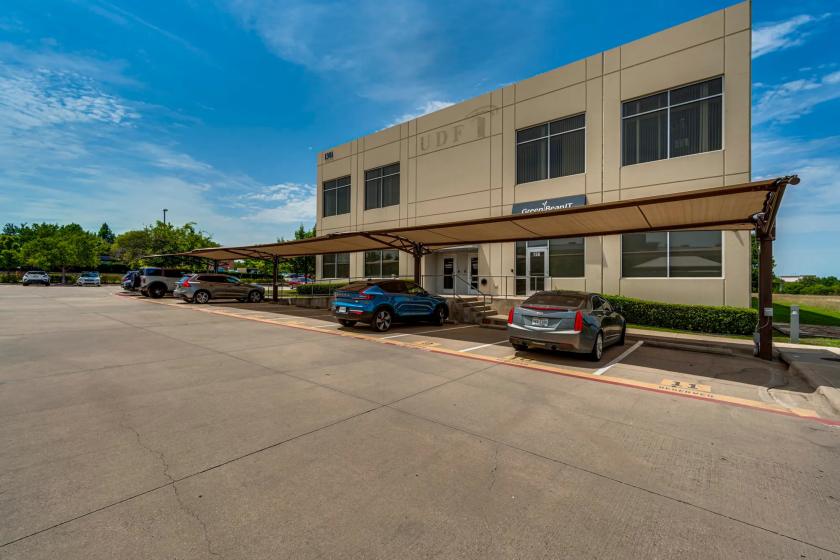
- • Covered parking available
- • Very strong sub-market with excellent demographics
- • Building signage available
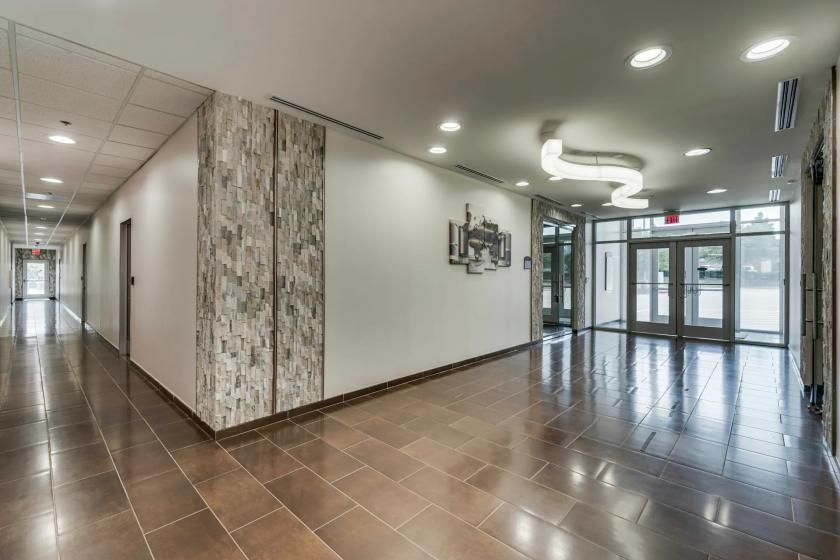
Additional Photos
Listing Agents

Cincha Kostman
O: 214-389-3665
M: 214-212-1998
Kostman@HudsonPeters.com
O: 214-389-3665
M: 214-212-1998
Kostman@HudsonPeters.com

Elizabeth Ocando
O: 214-389-3666
M: 678-925-8271
ocando@hudsonpeters.com
O: 214-389-3666
M: 678-925-8271
ocando@hudsonpeters.com
While we strive to provide the most accurate information, all listing information, and demographic data, is provided by third-parties. As such, MyEListing will not be responsible for the accuracy of the information. It is strongly recommended that you verify all information with the listing agent, and any relevant agencies, prior to making any decisions.