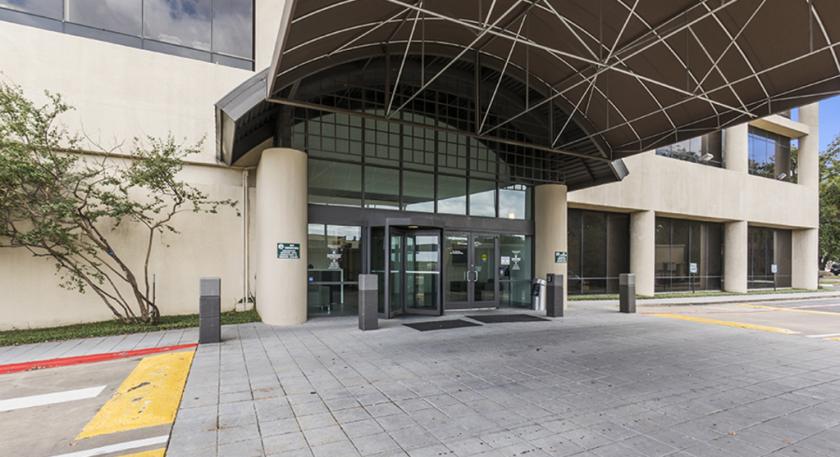
Office Space
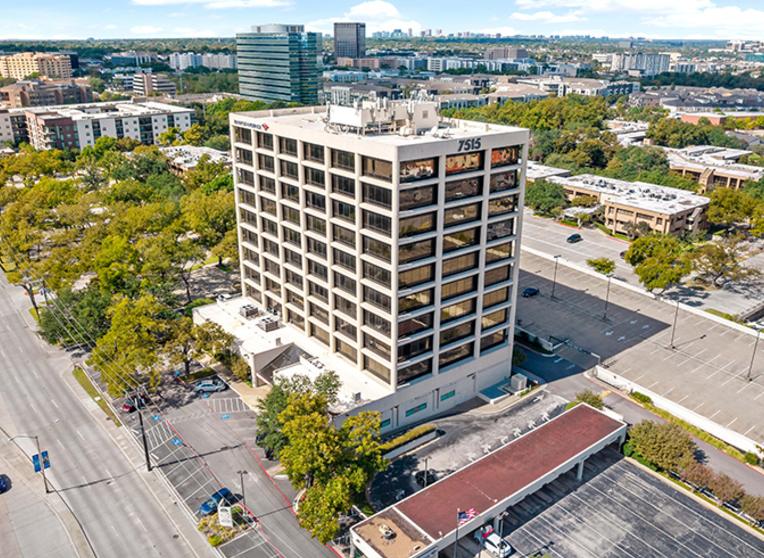
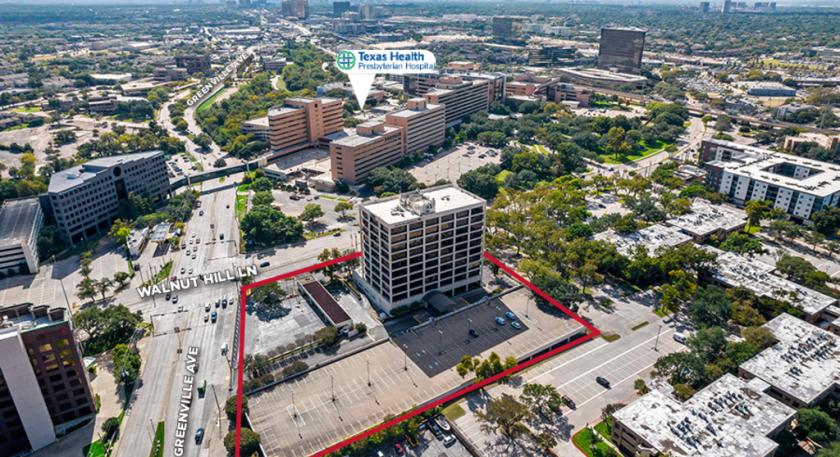
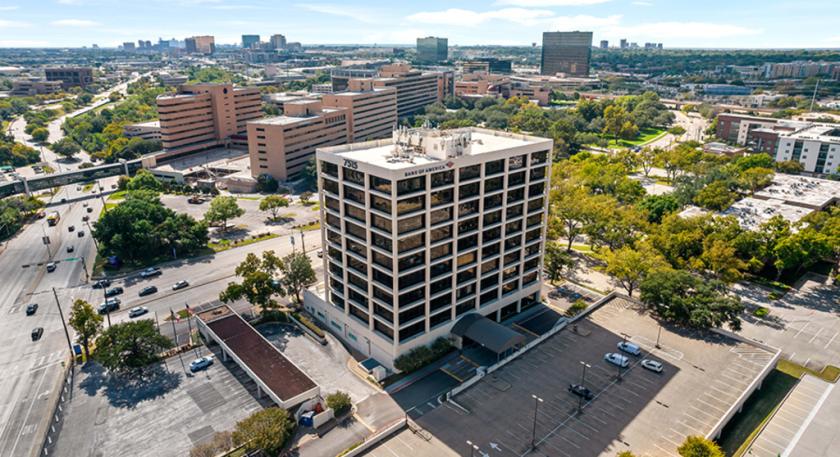
7515 Greenville Avenue Dallas, TX 75231
7515 Greenville Avenue Dallas, TX 75231
Details & Description
Property Highlights
- • Café/Deli: Food Service/Restaurant
- • Parking Ratio: 3.70
- • Security: Security Guard and Controlled Access
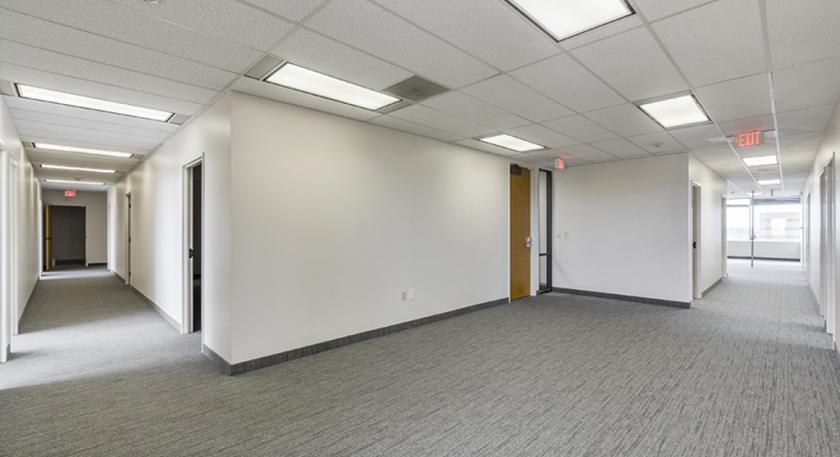
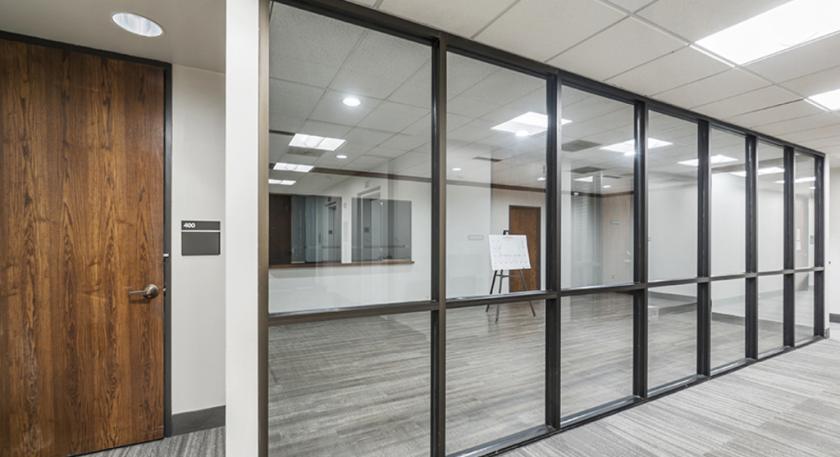
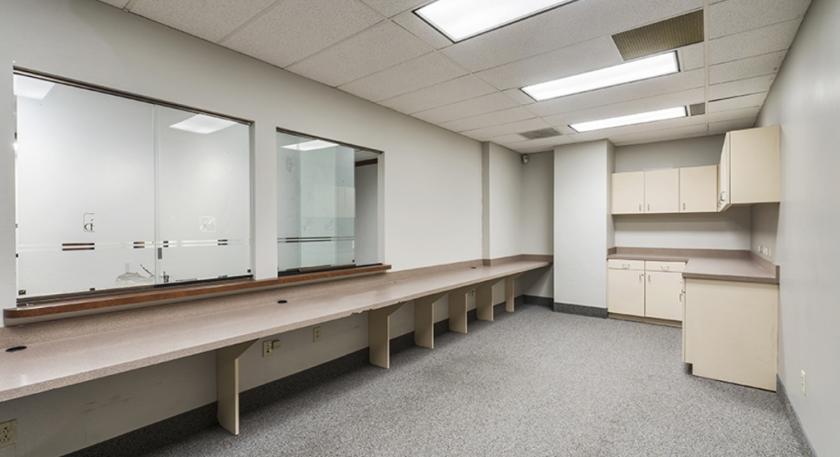
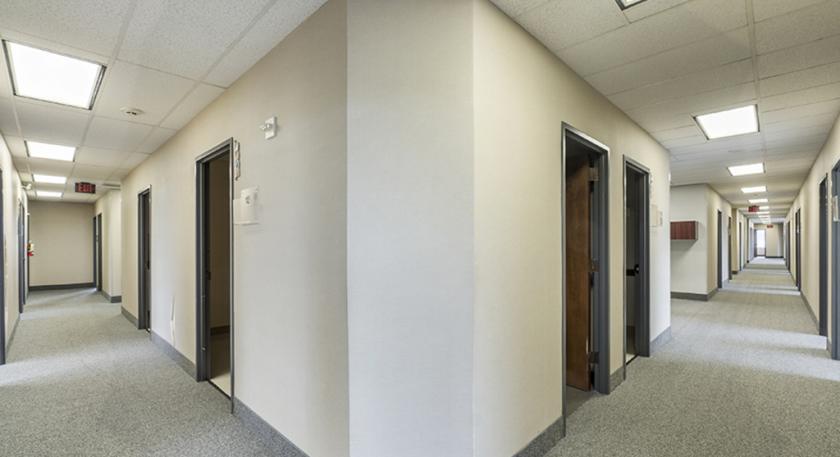
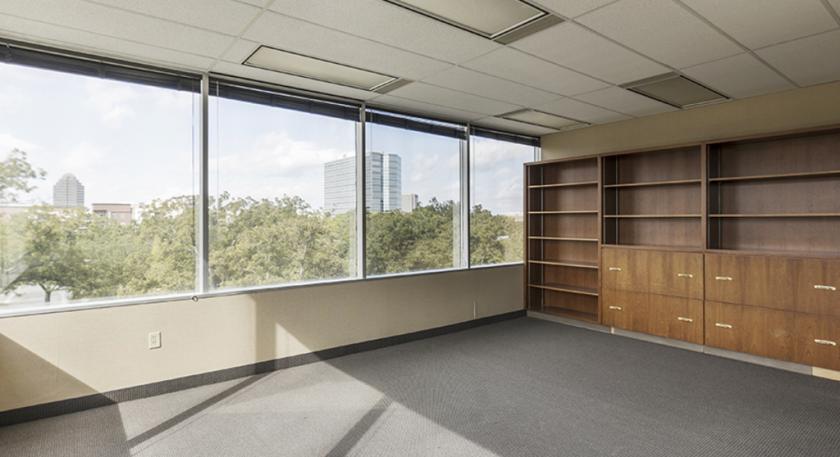
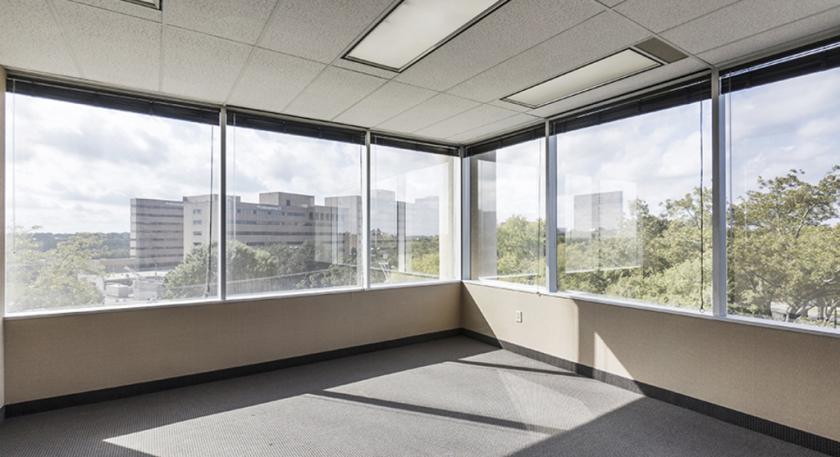
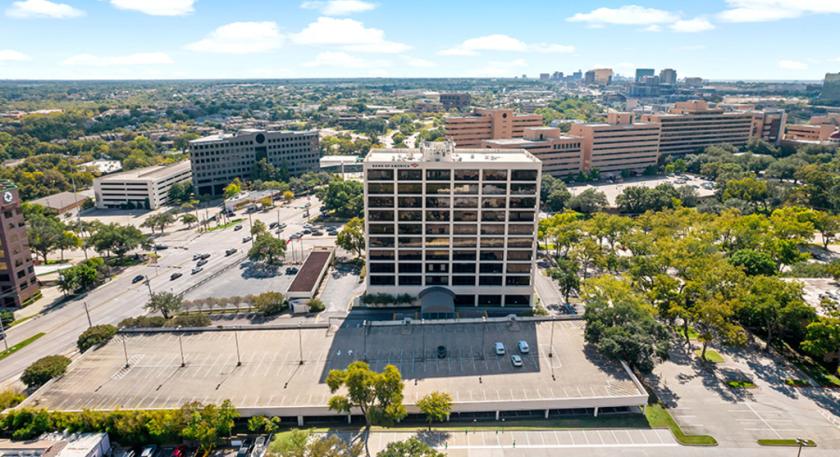
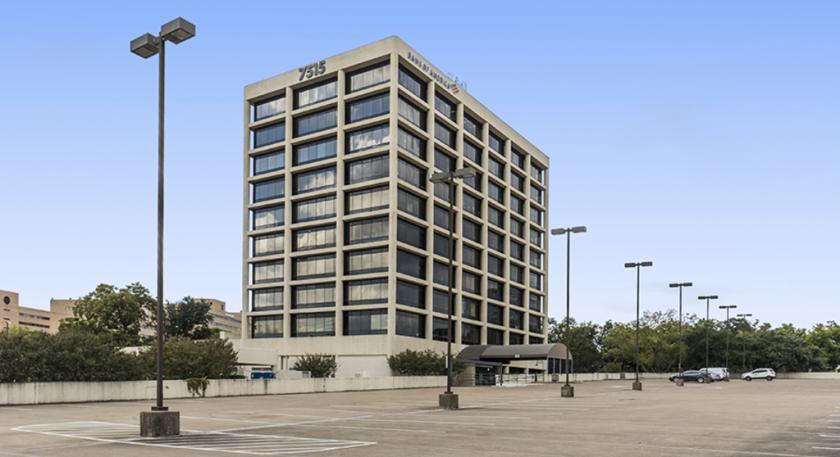
Additional Photos
Listing Agents

Erik Blais
O: 817-921-8179
M: 972-955-2391
eblais@bradford.com
O: 817-921-8179
M: 972-955-2391
eblais@bradford.com

Jared Laake
O: 972-776-7045
jlaake@bradford.com
O: 972-776-7045
jlaake@bradford.com
While we strive to provide the most accurate information, all listing information, and demographic data, is provided by third-parties. As such, MyEListing will not be responsible for the accuracy of the information. It is strongly recommended that you verify all information with the listing agent, and any relevant agencies, prior to making any decisions.