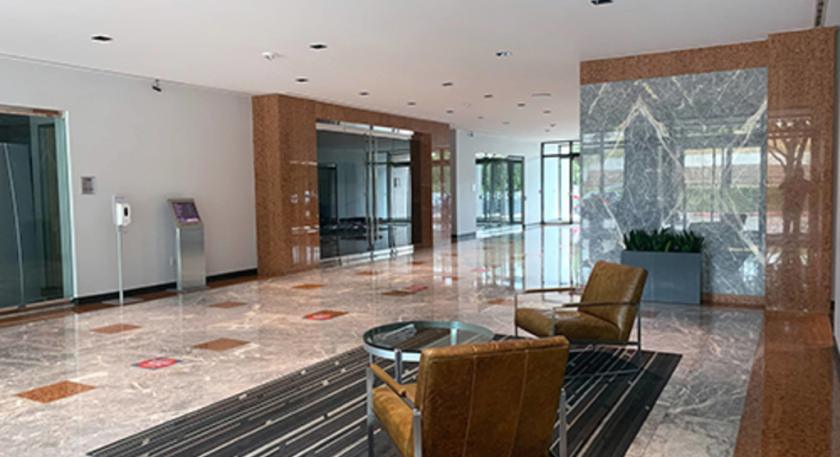
Office Space
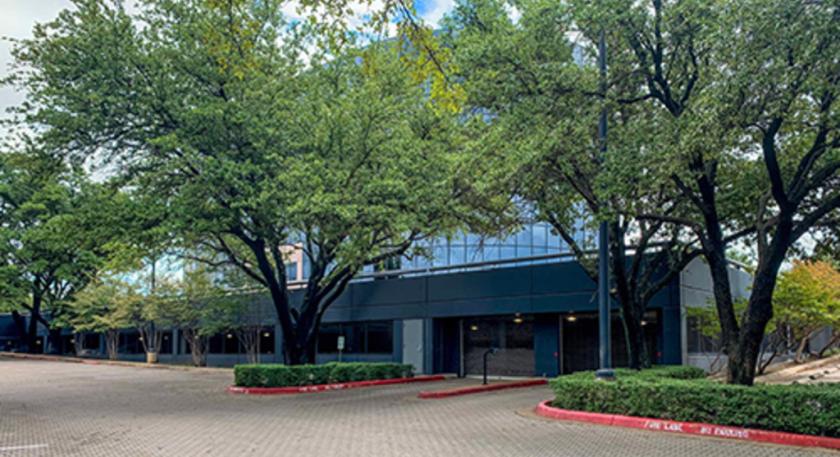
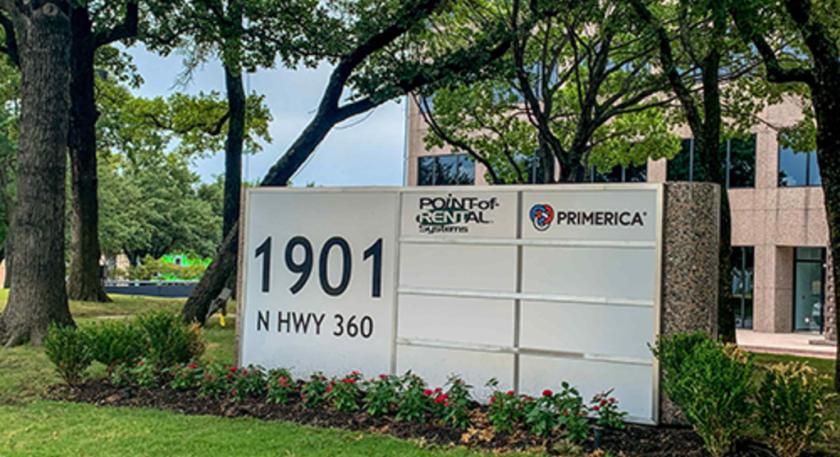
1901 N State Highway 360 Grand Prairie, TX 75050
1901 N State Highway 360 Grand Prairie, TX 75050

Details & Description
Property Highlights
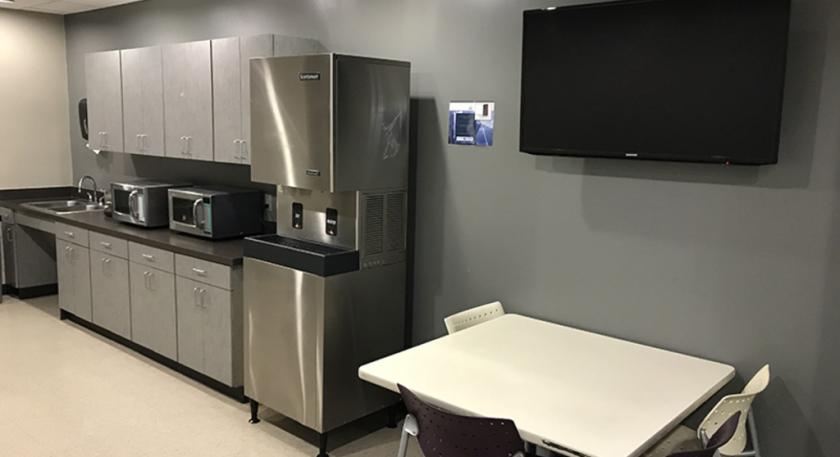
- • Café/Deli: Yes
- • Parking: Ample surface and reserved garage parking
- • Parking Ratio: 6:1000
- • Security: Key-Card
- • On-site Management: Property Manager On-Site
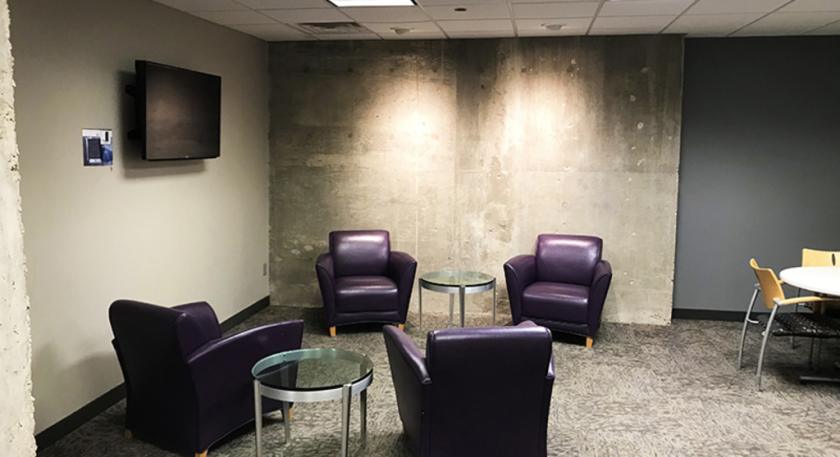
Additional Photos


Listing Agents

Erik Blais
O: 817-921-8179
M: 972-955-2391
eblais@bradford.com
O: 817-921-8179
M: 972-955-2391
eblais@bradford.com

Jared Laake
O: 972-776-7045
jlaake@bradford.com
O: 972-776-7045
jlaake@bradford.com

Richmond Collinsworth
O: 972-776-7041
rcollinsworth@bradford.com
O: 972-776-7041
rcollinsworth@bradford.com
While we strive to provide the most accurate information, all listing information, and demographic data, is provided by third-parties. As such, MyEListing will not be responsible for the accuracy of the information. It is strongly recommended that you verify all information with the listing agent, and any relevant agencies, prior to making any decisions.