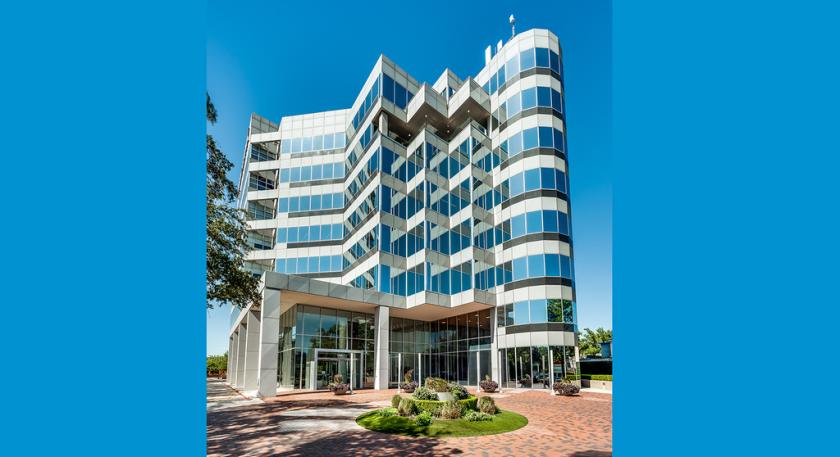
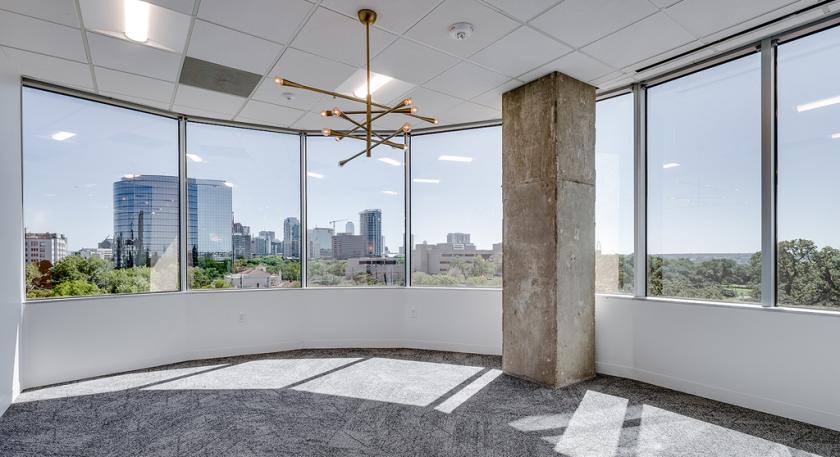
Office Space
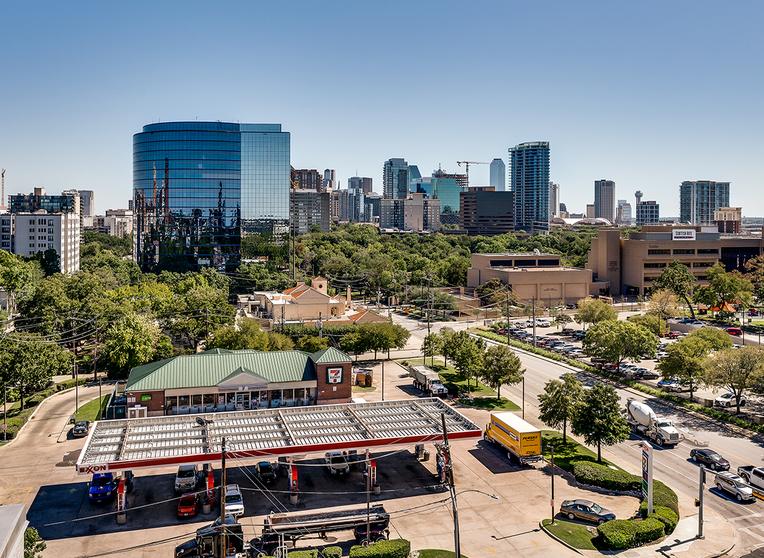
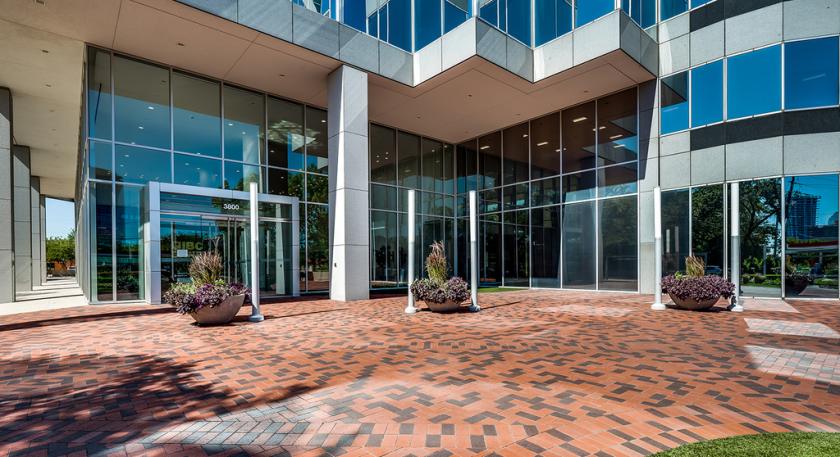
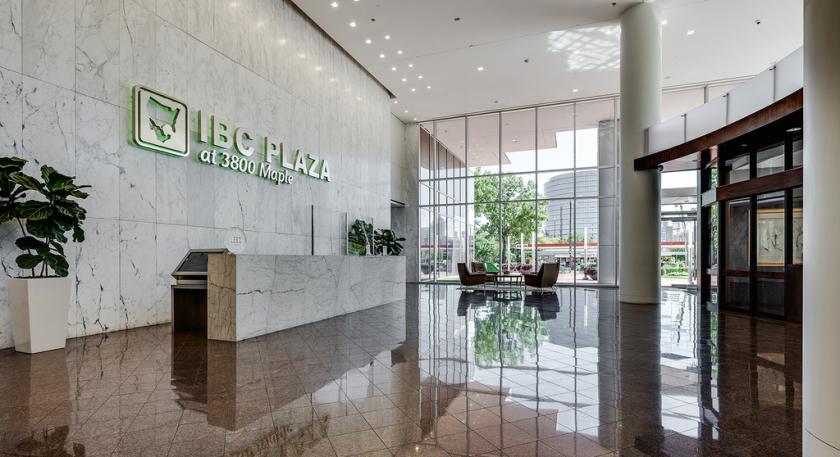
3800 Maple Avenue Dallas, TX 75219
3800 Maple Avenue Dallas, TX 75219
Details & Description
Property Highlights
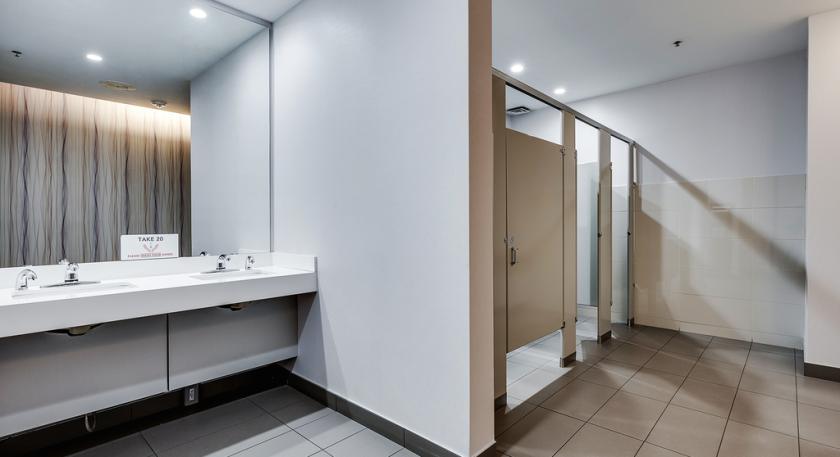
- • Fitness Center: Yes with Locker Rooms
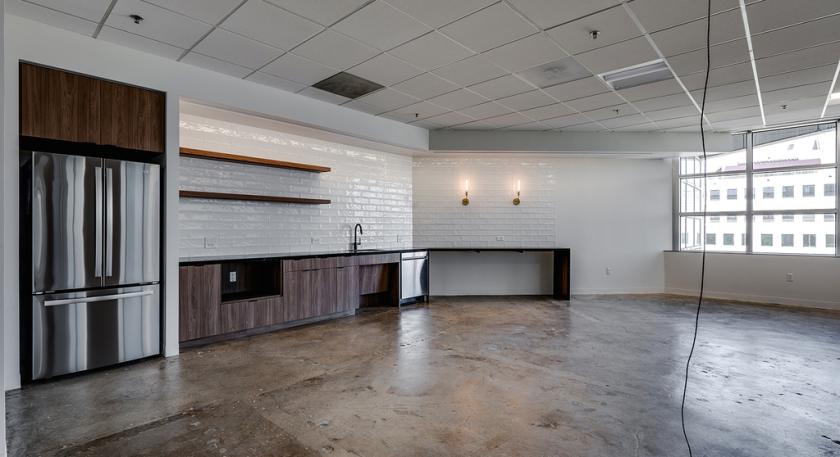
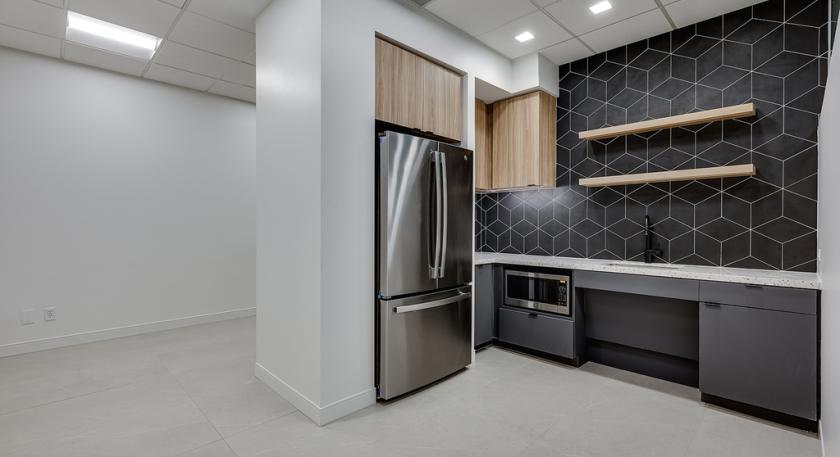
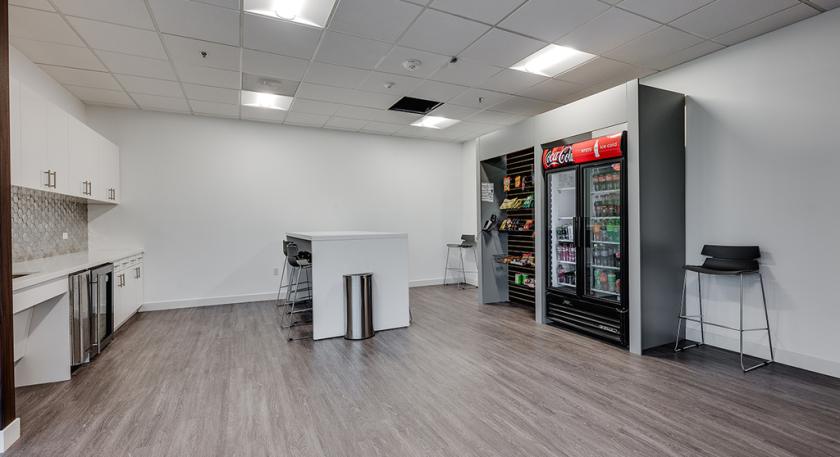
- • Café/Deli: Grab and Go Deli
- • Parking: Covered Parking
- • Security: Yes
- • On-site Management: Yes
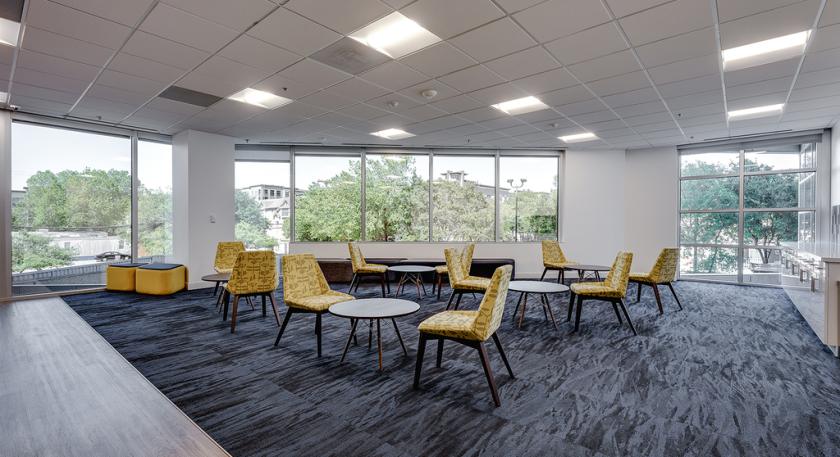
- • Building Conference Center: Yes
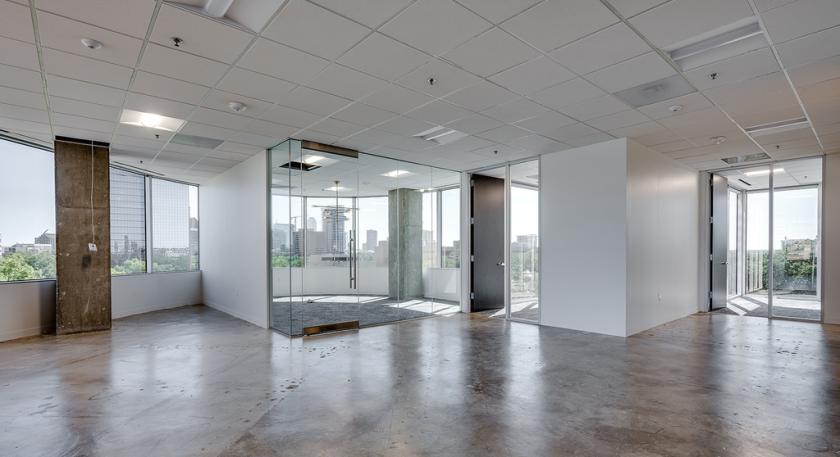
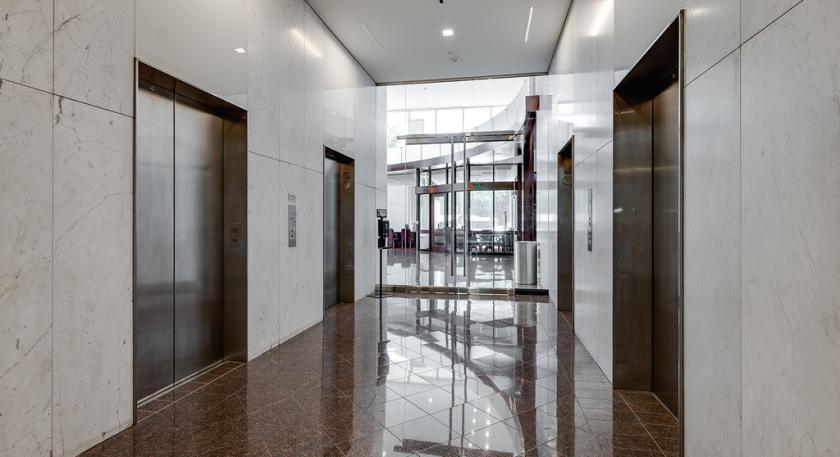
Additional Photos
Listing Agents

Richmond Collinsworth
O: 972-776-7041
rcollinsworth@bradford.com
O: 972-776-7041
rcollinsworth@bradford.com

Jared Laake
O: 972-776-7045
jlaake@bradford.com
O: 972-776-7045
jlaake@bradford.com
While we strive to provide the most accurate information, all listing information, and demographic data, is provided by third-parties. As such, MyEListing will not be responsible for the accuracy of the information. It is strongly recommended that you verify all information with the listing agent, and any relevant agencies, prior to making any decisions.