Retail Space
551 East Audie Murphy Parkway Farmersville, TX 75442
551 East Audie Murphy Parkway Farmersville, TX 75442
Details & Description
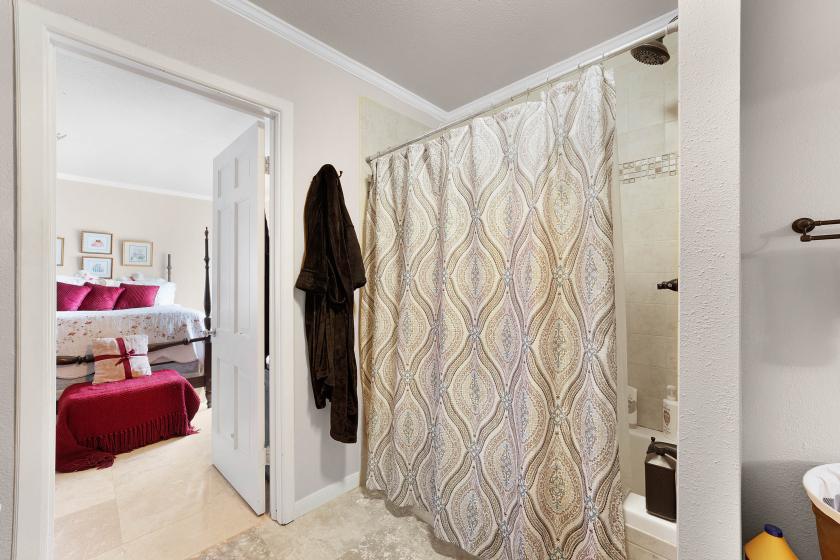
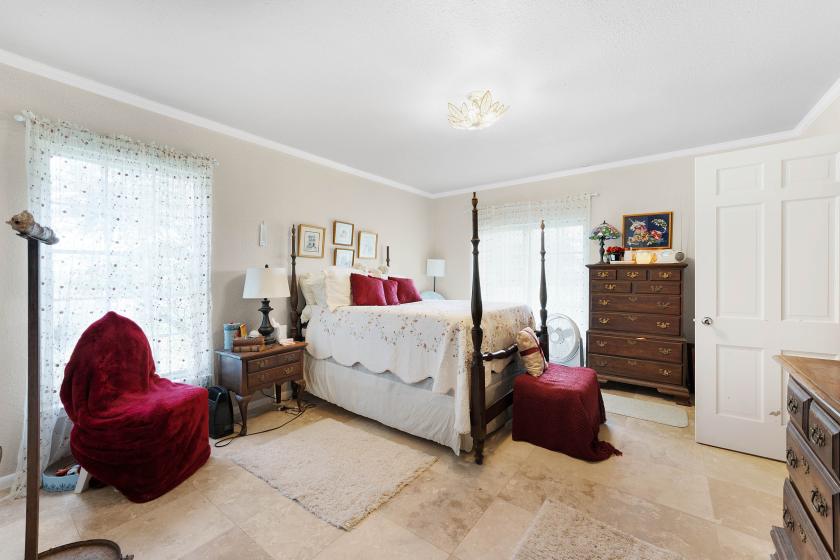
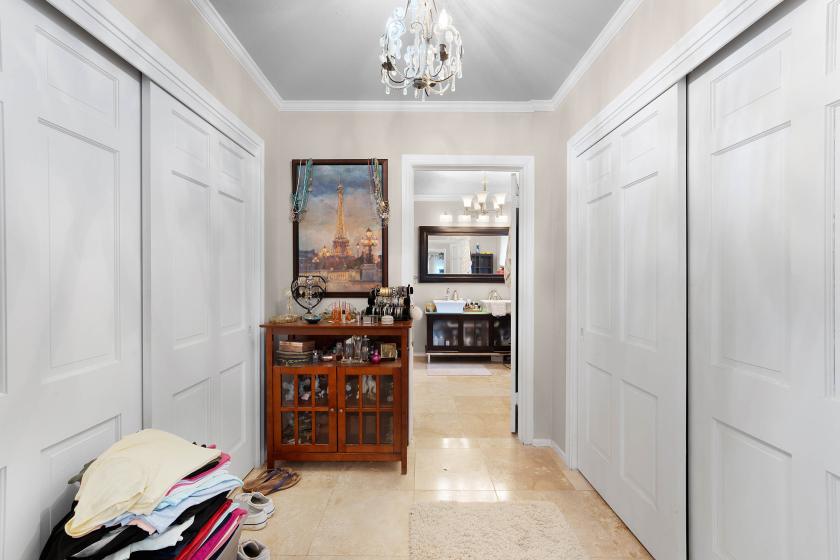
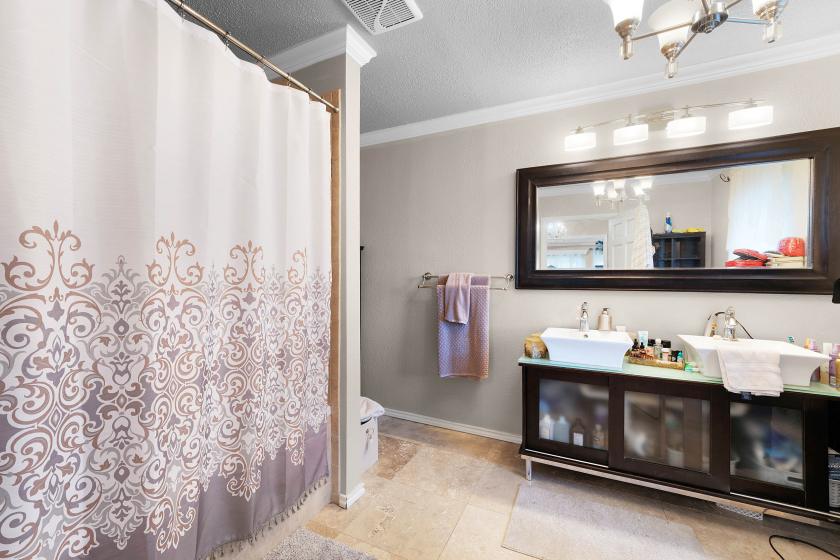
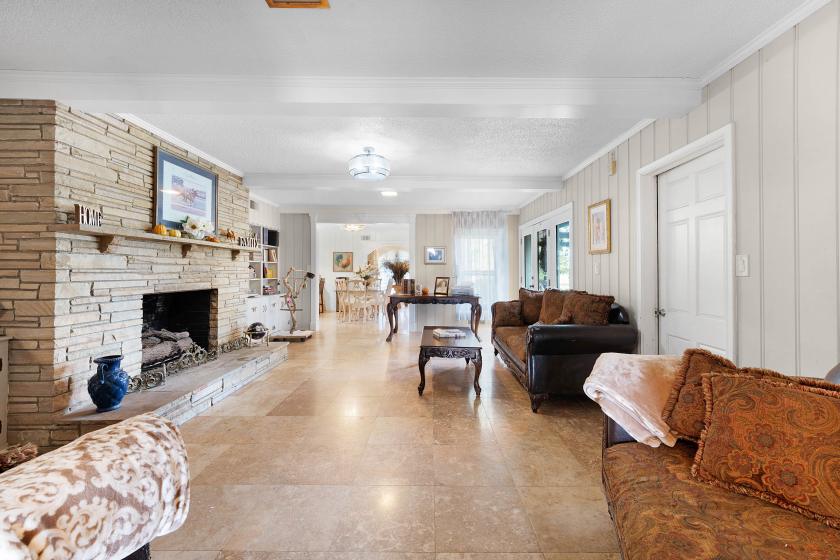
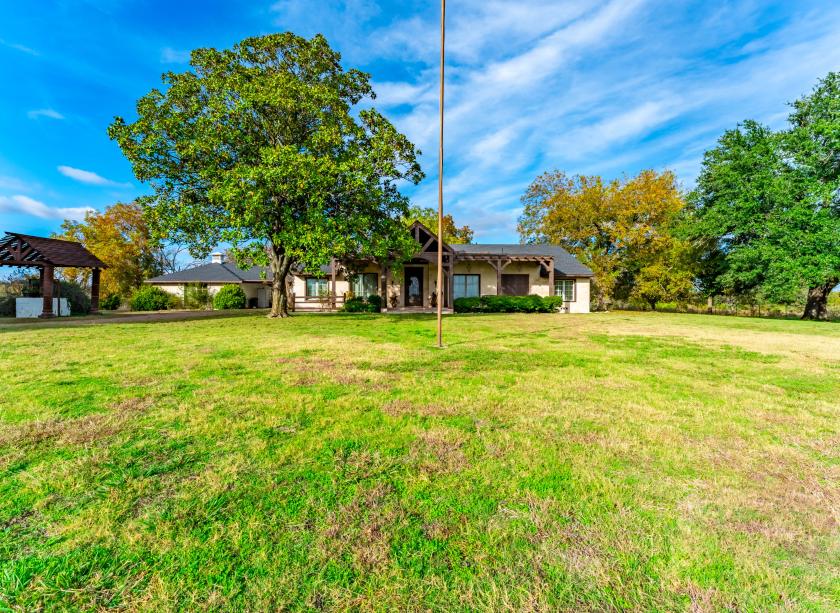
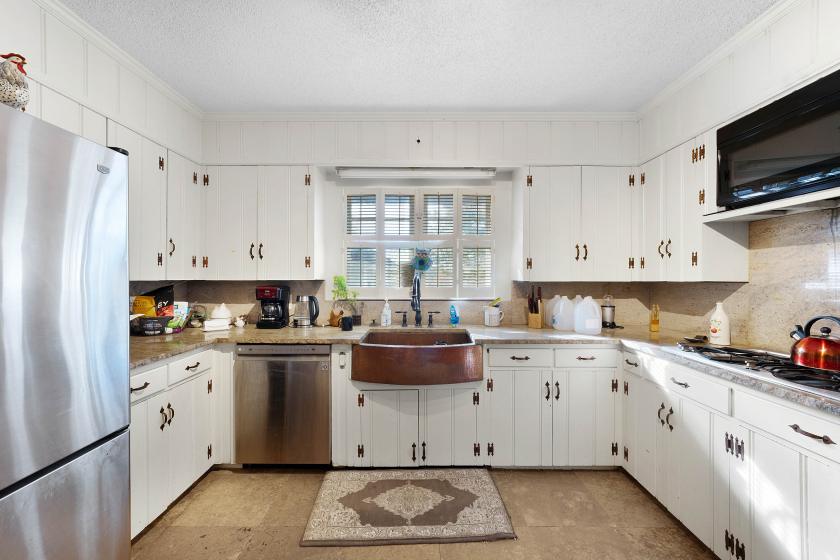
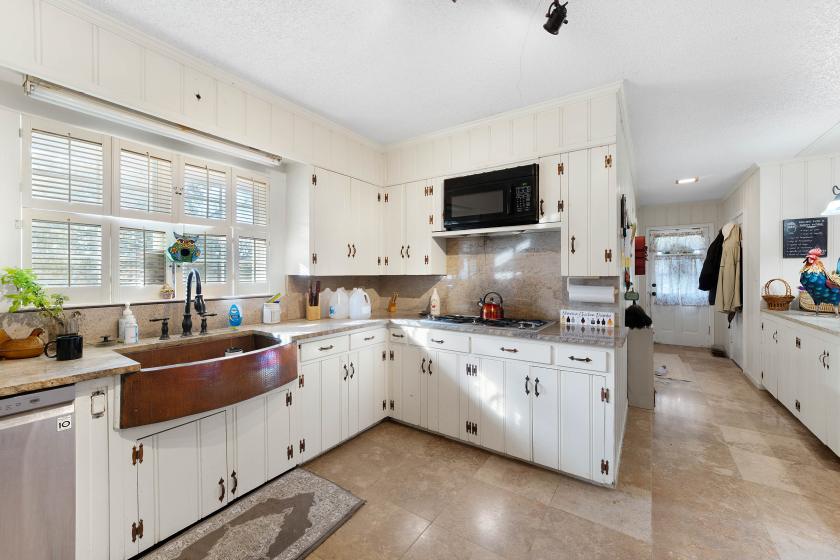
Additional Photos

Listing Agents

Kevin Weable
O: 972-772-6025
M: 972-845-1663
kevin@mdregroup.com
O: 972-772-6025
M: 972-845-1663
kevin@mdregroup.com
While we strive to provide the most accurate information, all listing information, and demographic data, is provided by third-parties. As such, MyEListing will not be responsible for the accuracy of the information. It is strongly recommended that you verify all information with the listing agent, and any relevant agencies, prior to making any decisions.