Commercial Land
13389 US Hwy 90 San Antonio, TX 78245
13389 US Hwy 90 San Antonio, TX 78245
Details & Description
Property Highlights
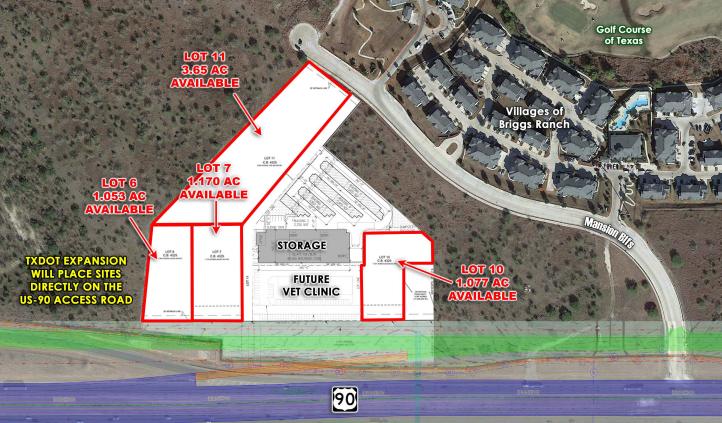
• IMPROVEMENTS: Water, Sewer, Storm Drain, Private Road, and Master Detention Infrastructure has been completed.
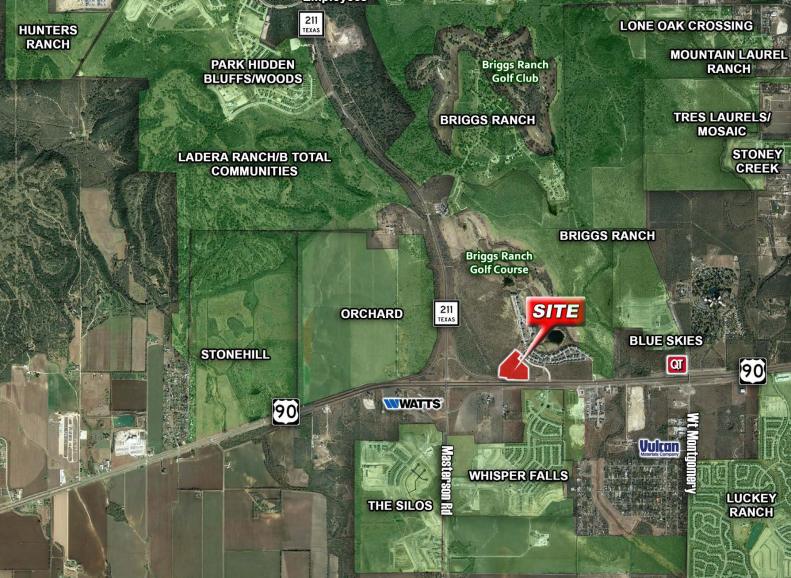
• The subject tract is located on Hwy 90 between SH-211 & Mansion Blfs., just west of Loop 1604
Listing Agents

Peter Goff
O: 210-496-7775
pgoff@dirtdealers.com
O: 210-496-7775
pgoff@dirtdealers.com
While we strive to provide the most accurate information, all listing information, and demographic data, is provided by third-parties. As such, MyEListing will not be responsible for the accuracy of the information. It is strongly recommended that you verify all information with the listing agent, and any relevant agencies, prior to making any decisions.