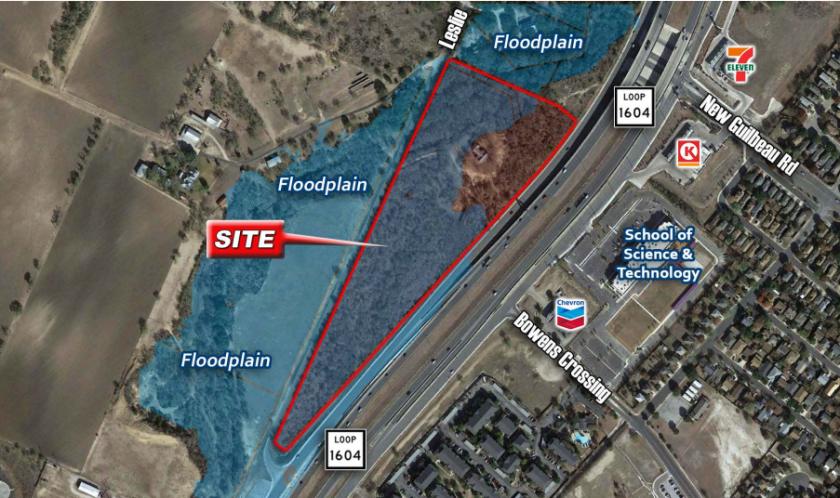
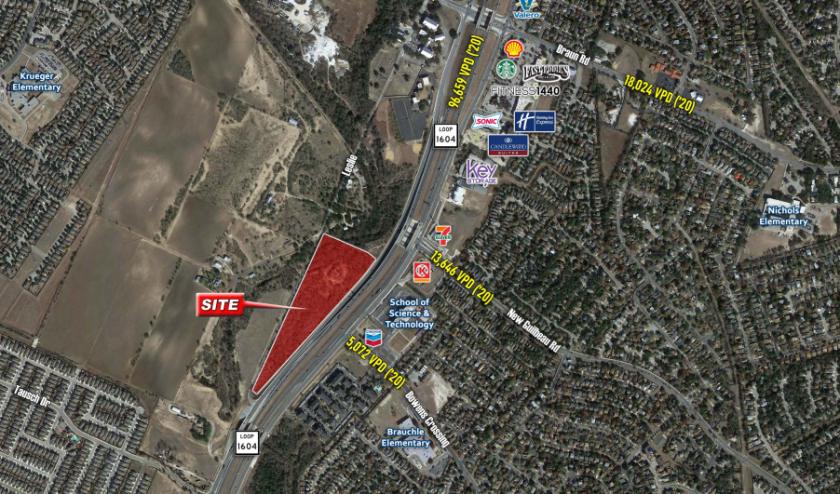
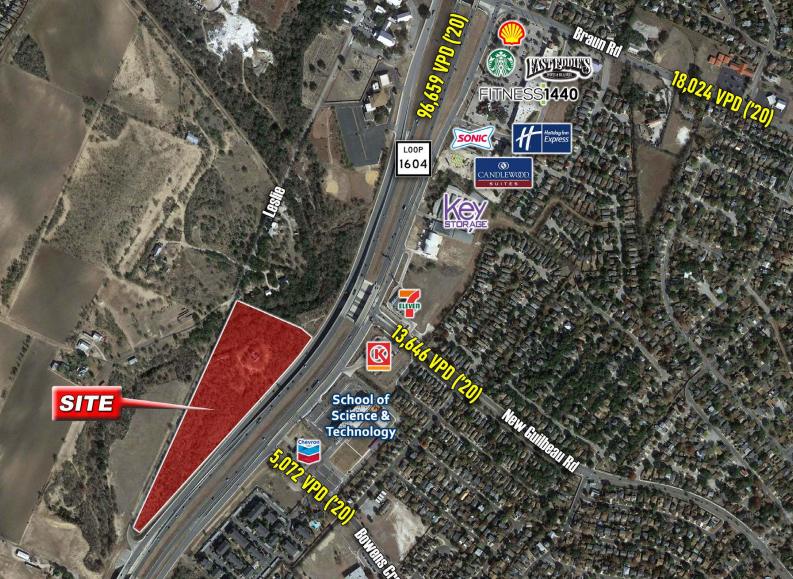
1-Mile | 3-Miles | 5-Miles | ||
---|---|---|---|---|
Total Population | 17,387 | 119,973 | 247,029 | |
Population Median Age | 31 | 34 | 35 | |
Population by Age | 0-9 Yrs | 2873 (16%) | 17471 (14%) | 34259 (13%) |
10-19 Yrs | 2822 (16%) | 17955 (14%) | 35845 (14%) | |
20-29 Yrs | 2952 (16%) | 18123 (15%) | 40201 (16%) | |
30-39 Yrs | 3011 (17%) | 19994 (16%) | 39739 (16%) | |
40-49 Yrs | 2219 (12%) | 15413 (12%) | 31958 (12%) | |
50-59 Yrs | 1766 (10%) | 14452 (12%) | 28757 (11%) | |
60-69 Yrs | 1089 (6%) | 10083 (8%) | 20886 (8%) | |
70+ Yrs | 656 (3%) | 6483 (5%) | 15384 (6%) | |
Median HH Income | $79,735 | $84,459 | $81,811 | |
Total Household Income | < 24K | 356 (7%) | 3050 (8%) | 7663 (10%) |
25-49K | 868 (17%) | 5243 (14%) | 12582 (16%) | |
50-74K | 1032 (21%) | 7180 (20%) | 14649 (19%) | |
75-99K | 962 (19%) | 5906 (16%) | 11872 (15%) | |
100-199K | 1493 (30%) | 12361 (34%) | 24729 (32%) | |
200K+ | 165 (3%) | 1676 (4%) | 4763 (6%) | |
Highest Education Level | No Diploma | 677 | 4945 | 10691 |
Diploma or GED | 2269 | 16210 | 32340 | |
Some College | 2424 | 19162 | 38704 | |
Assoc. Degree | 1289 | 8099 | 16962 | |
Bachelors Degree | 2149 | 18158 | 38156 | |
Higher Degree | 1246 | 9576 | 20716 | |
Total Housing Units | 4,994 | 36,663 | 79,732 | |
--Owner-Occupied | 3,474 | 26,308 | 53,803 | |
--Renter-Occupied | 1,402 | 9,108 | 22,455 | |
Owner-Occupied Values | < 100K | 351 | 1828 | 3171 |
100-199K | 2014 | 12833 | 24598 | |
200-299K | 1005 | 9158 | 18141 | |
300-399K | 81 | 1841 | 5398 | |
400-499K | 7 | 271 | 1355 | |
500K+ | 16 | 377 | 1140 | |
Total Working Age Population | 12,471 | 90,640 | 190,470 | |
In Work Force | 9,386 | 65,744 | 136,845 | |
Not In Work Force | 3,086 | 24,896 | 53,625 | |
Workforce Employed | 8,975 | 61,718 | 127,163 | |
Workforce Unemployed | 323 | 3,346 | 7,955 | |
Civlian Workforce | 9,299 | 65,064 | 135,118 | |
Military Workforce | 87 | 680 | 1,727 | |
Total Households | 4,876 | 35,416 | 76,258 | |
Family Households | 3,823 | 27,449 | 56,016 | |
Non-Family Households | 1,053 | 7,967 | 20,242 | |
Married Couple | 2,794 | 20,463 | 42,056 | |
Other Family | 1,029 | 6,986 | 13,960 | |
Married w/Child | 1,535 | 9,723 | 19,735 | |
Single Male w/Child | 137 | 1,142 | 1,933 | |
Single Female w/Child | 491 | 2,589 | 5,290 |
Population Change Last Two Decades - Plus Projection
2000 | % | 2010 | % | 2020 | % | 2030 | |
---|---|---|---|---|---|---|---|
Texas | 20,851,820 | +21 | 25,145,561 | +18 | 29,677,668 | +18 | 34,894,452 |
Bexar County | 1,392,931 | +23 | 1,714,773 | +22 | 2,093,502 | +20 | 2,502,617 |
Total Working Age Population:
Total Households:
Total Working Age Population:
Total Households:
Total Working Age Population:
Total Households: