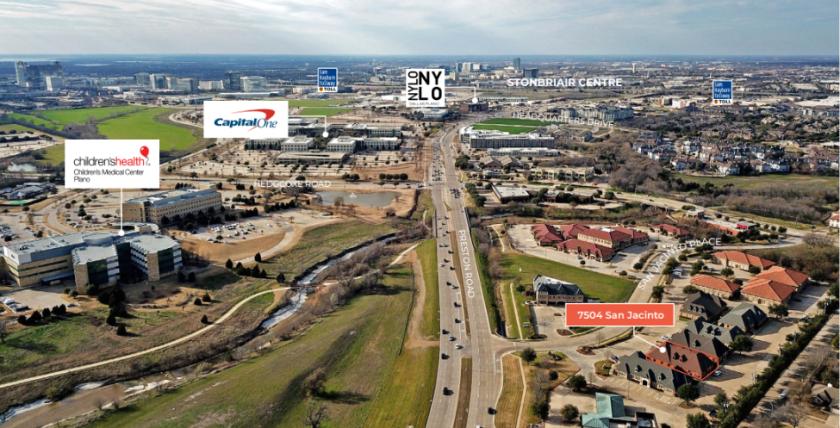
1-Mile | 3-Miles | 5-Miles | ||
---|---|---|---|---|
Total Population | 13,312 | 108,183 | 311,842 | |
Population Median Age | 34 | 38 | 38 | |
Population by Age | 0-9 Yrs | 2093 (15%) | 11764 (10%) | 36306 (11%) |
10-19 Yrs | 1427 (10%) | 14190 (13%) | 41555 (13%) | |
20-29 Yrs | 1767 (13%) | 13982 (12%) | 37192 (11%) | |
30-39 Yrs | 3151 (23%) | 17086 (15%) | 47101 (15%) | |
40-49 Yrs | 1833 (13%) | 17402 (16%) | 51170 (16%) | |
50-59 Yrs | 1478 (11%) | 16135 (14%) | 44660 (14%) | |
60-69 Yrs | 913 (6%) | 10907 (10%) | 30649 (9%) | |
70+ Yrs | 651 (4%) | 6717 (6%) | 23210 (7%) | |
Median HH Income | $106,875 | $108,419 | $105,640 | |
Total Household Income | < 24K | 389 (7%) | 2596 (6%) | 9232 (7%) |
25-49K | 568 (11%) | 5154 (12%) | 15252 (12%) | |
50-74K | 547 (10%) | 5641 (13%) | 16473 (13%) | |
75-99K | 802 (15%) | 6281 (14%) | 15885 (13%) | |
100-199K | 1883 (37%) | 14529 (33%) | 41270 (34%) | |
200K+ | 896 (17%) | 8705 (20%) | 22370 (18%) | |
Highest Education Level | No Diploma | 265 | 1412 | 8067 |
Diploma or GED | 841 | 7580 | 23129 | |
Some College | 865 | 10571 | 34736 | |
Assoc. Degree | 339 | 3838 | 14623 | |
Bachelors Degree | 3686 | 30867 | 84268 | |
Higher Degree | 2927 | 21384 | 52757 | |
Total Housing Units | 5,686 | 46,152 | 128,067 | |
--Owner-Occupied | 1,736 | 22,239 | 70,263 | |
--Renter-Occupied | 3,349 | 20,667 | 50,219 | |
Owner-Occupied Values | < 100K | 51 | 120 | 905 |
100-199K | 3 | 460 | 4282 | |
200-299K | 114 | 2995 | 15730 | |
300-399K | 426 | 7027 | 21186 | |
400-499K | 495 | 5716 | 12427 | |
500K+ | 648 | 5921 | 15734 | |
Total Working Age Population | 10,148 | 87,473 | 249,145 | |
In Work Force | 7,152 | 62,238 | 176,972 | |
Not In Work Force | 2,996 | 25,234 | 72,173 | |
Workforce Employed | 6,836 | 59,602 | 170,236 | |
Workforce Unemployed | 292 | 2,562 | 6,537 | |
Civlian Workforce | 7,128 | 62,164 | 176,773 | |
Military Workforce | 24 | 74 | 199 | |
Total Households | 5,085 | 42,906 | 120,482 | |
Family Households | 3,668 | 29,259 | 83,067 | |
Non-Family Households | 1,417 | 13,647 | 37,415 | |
Married Couple | 3,302 | 25,134 | 69,384 | |
Other Family | 366 | 4,125 | 13,682 | |
Married w/Child | 2,076 | 12,630 | 34,502 | |
Single Male w/Child | 47 | 550 | 1,640 | |
Single Female w/Child | 130 | 1,441 | 5,507 |
Population Change Last Two Decades - Plus Projection
2000 | % | 2010 | % | 2020 | % | 2030 | |
---|---|---|---|---|---|---|---|
Texas | 20,851,820 | +21 | 25,145,561 | +18 | 29,677,668 | +18 | 34,894,452 |
Denton County | 432,976 | +53 | 662,614 | +36 | 897,953 | +37 | 1,234,110 |
Collin County | 491,675 | +59 | 782,341 | +33 | 1,039,369 | +34 | 1,391,461 |
Total Working Age Population:
Total Households:
Total Working Age Population:
Total Households:
Total Working Age Population:
Total Households: