Commercial Land
11980 W. SH 29 W. Liberty Hill, TX 78642
11980 W. SH 29 W. Liberty Hill, TX 78642
Details & Description
Property Highlights
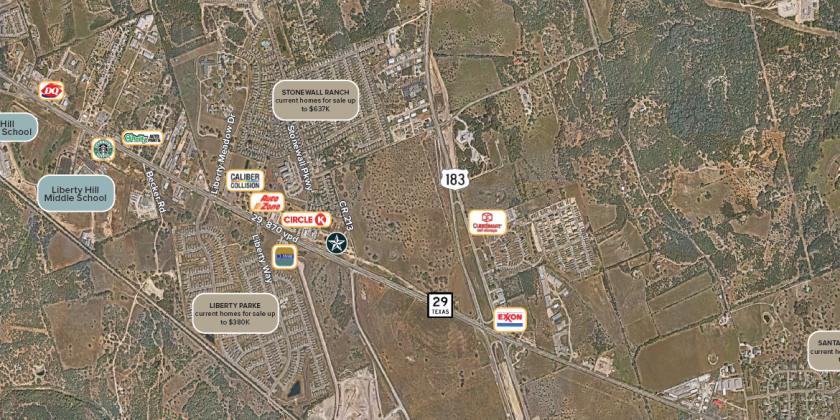
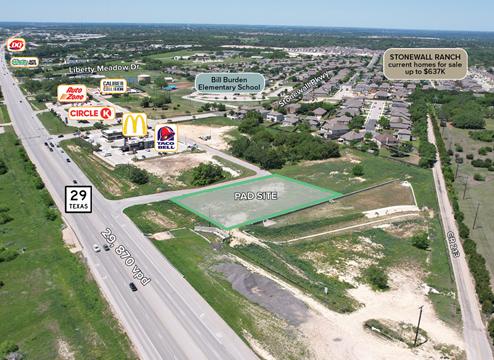
- • SEQ W. State Highway 29 & Stonewall Parkway
- • Utilities at Property Line
- • Regional Detention Offsite
- • Entrance to Stonewall Ranch Master Plan community
Listing Agents

Barrett Von Blon
O: 713-577-1777
M: 832-563-9996
barrett.vonblon@cbre.com
O: 713-577-1777
M: 832-563-9996
barrett.vonblon@cbre.com

Chris Bergmann Jr.
O: 713-577-1600
chris.bergmann@cbre.com
O: 713-577-1600
chris.bergmann@cbre.com
While we strive to provide the most accurate information, all listing information, and demographic data, is provided by third-parties. As such, MyEListing will not be responsible for the accuracy of the information. It is strongly recommended that you verify all information with the listing agent, and any relevant agencies, prior to making any decisions.