Office Space
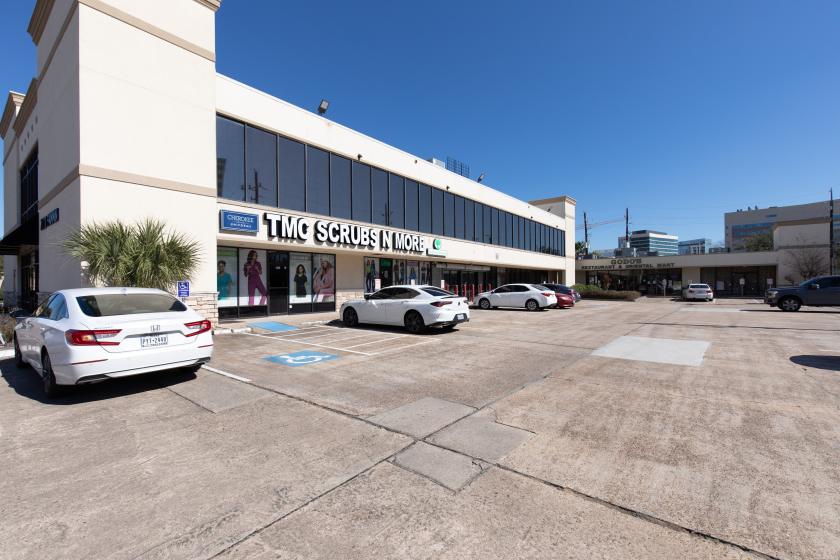
7227 Fannin Street Houston, TX 77030
7227 Fannin Street Houston, TX 77030

Details & Description
Property Highlights
- • Card Key Access
- • On-site Management
- • Restaurant and Signage
- • Two Floor Building
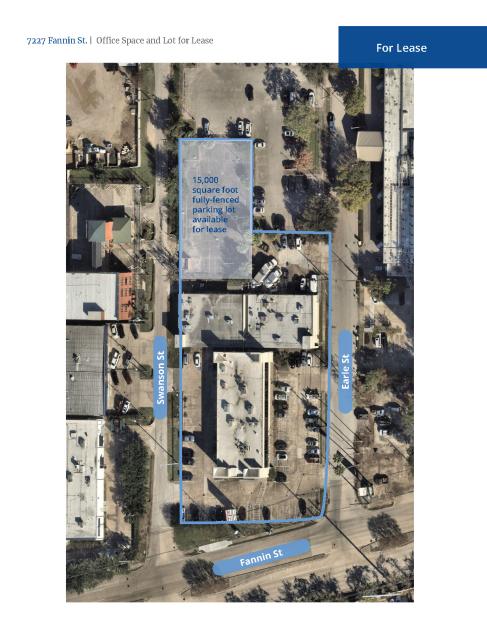
- • Free surface parking available
- • 3.0/1,000 SF parking ratio
Additional Photos

Listing Agents

Douglas Pack
O: 713-835-0041
M: 713-818-5782
doug.pack@colliers.com
O: 713-835-0041
M: 713-818-5782
doug.pack@colliers.com

Sam Hansen
O: 713-835-0040
M: 281-684-1766
sam.hansen@colliers.com
O: 713-835-0040
M: 281-684-1766
sam.hansen@colliers.com
While we strive to provide the most accurate information, all listing information, and demographic data, is provided by third-parties. As such, MyEListing will not be responsible for the accuracy of the information. It is strongly recommended that you verify all information with the listing agent, and any relevant agencies, prior to making any decisions.


