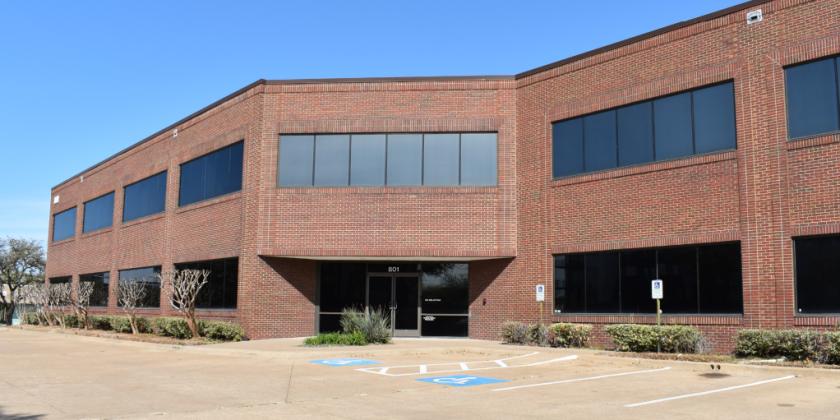
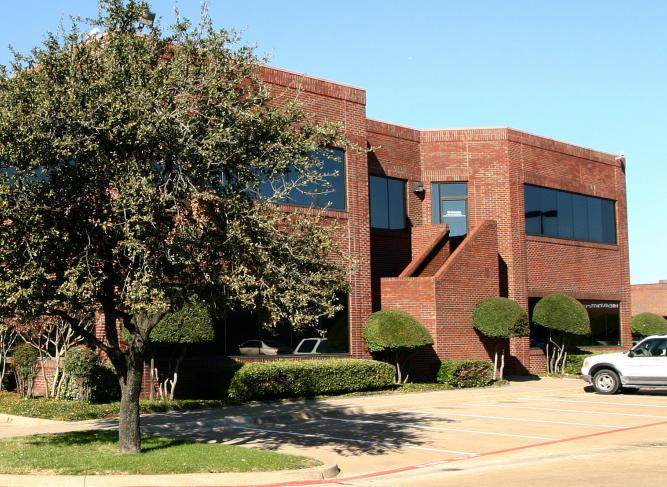
1-Mile | 3-Miles | 5-Miles | ||
---|---|---|---|---|
Total Population | 6,864 | 99,284 | 299,688 | |
Population Median Age | 36 | 38 | 38 | |
Population by Age | 0-9 Yrs | 515 (7%) | 11121 (11%) | 34249 (11%) |
10-19 Yrs | 606 (8%) | 11972 (12%) | 38131 (12%) | |
20-29 Yrs | 1841 (26%) | 16180 (16%) | 45639 (15%) | |
30-39 Yrs | 1315 (19%) | 14958 (15%) | 43290 (14%) | |
40-49 Yrs | 959 (13%) | 12734 (12%) | 37425 (12%) | |
50-59 Yrs | 645 (9%) | 11968 (12%) | 39639 (13%) | |
60-69 Yrs | 705 (10%) | 10773 (10%) | 32006 (10%) | |
70+ Yrs | 279 (4%) | 9579 (9%) | 29310 (9%) | |
Median HH Income | $63,038 | $78,175 | $82,643 | |
Total Household Income | < 24K | 580 (16%) | 4258 (11%) | 12797 (11%) |
25-49K | 643 (18%) | 6337 (16%) | 18825 (17%) | |
50-74K | 953 (27%) | 7488 (19%) | 19020 (17%) | |
75-99K | 399 (11%) | 5568 (14%) | 14965 (13%) | |
100-199K | 692 (20%) | 10049 (26%) | 32965 (29%) | |
200K+ | 187 (5%) | 3881 (10%) | 11864 (10%) | |
Highest Education Level | No Diploma | 450 | 7185 | 17802 |
Diploma or GED | 744 | 9842 | 29341 | |
Some College | 1215 | 13737 | 40392 | |
Assoc. Degree | 363 | 4600 | 15087 | |
Bachelors Degree | 1244 | 20459 | 65255 | |
Higher Degree | 800 | 11530 | 37267 | |
Total Housing Units | 3,890 | 39,770 | 117,028 | |
--Owner-Occupied | 489 | 21,396 | 65,425 | |
--Renter-Occupied | 2,966 | 16,185 | 45,012 | |
Owner-Occupied Values | < 100K | 47 | 863 | 1992 |
100-199K | 118 | 4312 | 11811 | |
200-299K | 118 | 6855 | 21488 | |
300-399K | 123 | 5600 | 18397 | |
400-499K | 40 | 2140 | 7428 | |
500K+ | 43 | 1626 | 4308 | |
Total Working Age Population | 5,902 | 81,127 | 242,877 | |
In Work Force | 4,632 | 56,420 | 167,700 | |
Not In Work Force | 1,269 | 24,707 | 75,177 | |
Workforce Employed | 4,341 | 53,999 | 159,919 | |
Workforce Unemployed | 291 | 2,416 | 7,681 | |
Civlian Workforce | 4,632 | 56,415 | 167,599 | |
Military Workforce | 0 | 5 | 100 | |
Total Households | 3,455 | 37,581 | 110,437 | |
Family Households | 1,411 | 24,315 | 75,290 | |
Non-Family Households | 2,044 | 13,266 | 35,147 | |
Married Couple | 946 | 18,084 | 57,598 | |
Other Family | 465 | 6,231 | 17,692 | |
Married w/Child | 284 | 7,021 | 24,040 | |
Single Male w/Child | 51 | 878 | 2,249 | |
Single Female w/Child | 177 | 2,408 | 6,370 |
Population Change Last Two Decades - Plus Projection
2000 | % | 2010 | % | 2020 | % | 2030 | |
---|---|---|---|---|---|---|---|
Texas | 20,851,820 | +21 | 25,145,561 | +18 | 29,677,668 | +18 | 34,894,452 |
Collin County | 491,675 | +59 | 782,341 | +33 | 1,039,369 | +34 | 1,391,461 |
Dallas County | 2,218,899 | +7 | 2,368,139 | +15 | 2,734,111 | +14 | 3,106,298 |
Total Working Age Population:
Total Households:
Total Working Age Population:
Total Households:
Total Working Age Population:
Total Households: