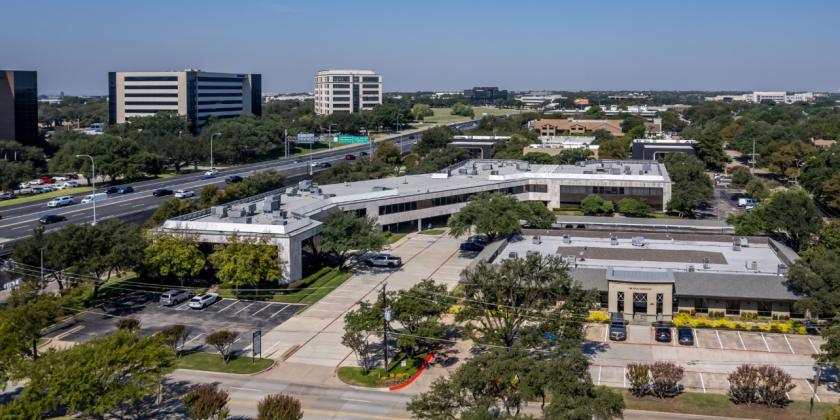
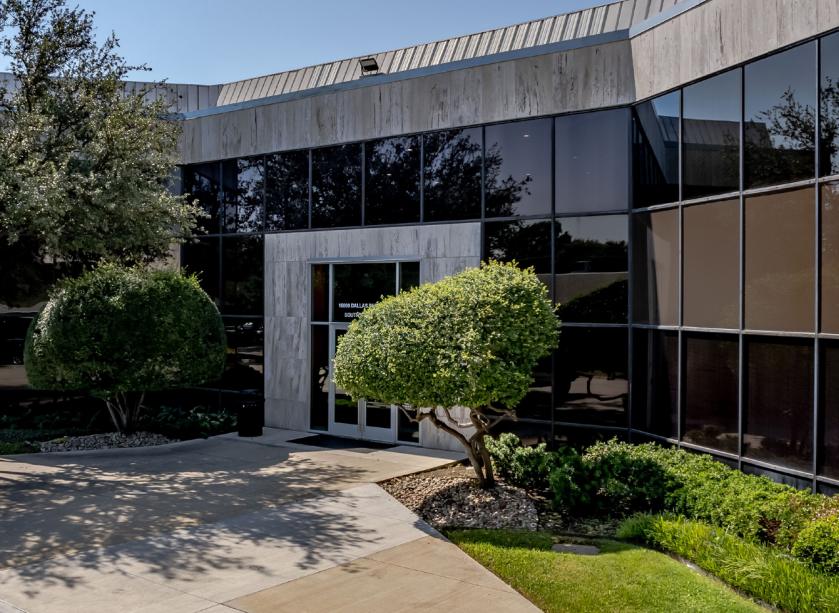
1-Mile | 3-Miles | 5-Miles | ||
---|---|---|---|---|
Total Population | 12,199 | 167,618 | 398,391 | |
Population Median Age | 41 | 38 | 38 | |
Population by Age | 0-9 Yrs | 841 (6%) | 19398 (11%) | 46573 (11%) |
10-19 Yrs | 437 (3%) | 12868 (7%) | 45055 (11%) | |
20-29 Yrs | 2888 (23%) | 31890 (19%) | 65042 (16%) | |
30-39 Yrs | 2664 (21%) | 32688 (19%) | 65835 (16%) | |
40-49 Yrs | 1309 (10%) | 22522 (13%) | 52360 (13%) | |
50-59 Yrs | 1533 (12%) | 18906 (11%) | 48665 (12%) | |
60-69 Yrs | 1176 (9%) | 15799 (9%) | 38512 (9%) | |
70+ Yrs | 1351 (11%) | 13549 (8%) | 36347 (9%) | |
Median HH Income | $80,854 | $66,533 | $71,097 | |
Total Household Income | < 24K | 778 (11%) | 10288 (12%) | 21682 (12%) |
25-49K | 1006 (14%) | 19463 (23%) | 35790 (21%) | |
50-74K | 1372 (19%) | 16813 (20%) | 30829 (18%) | |
75-99K | 1188 (17%) | 10825 (13%) | 20942 (12%) | |
100-199K | 1865 (27%) | 16511 (20%) | 38858 (23%) | |
200K+ | 660 (9%) | 7833 (9%) | 19180 (11%) | |
Highest Education Level | No Diploma | 331 | 6651 | 28029 |
Diploma or GED | 1086 | 18225 | 44690 | |
Some College | 1758 | 26144 | 53140 | |
Assoc. Degree | 682 | 7892 | 16415 | |
Bachelors Degree | 4262 | 41816 | 86794 | |
Higher Degree | 2023 | 23759 | 50453 | |
Total Housing Units | 7,831 | 91,346 | 184,357 | |
--Owner-Occupied | 1,892 | 26,446 | 73,862 | |
--Renter-Occupied | 4,978 | 55,287 | 93,419 | |
Owner-Occupied Values | < 100K | 63 | 694 | 2285 |
100-199K | 465 | 4009 | 13937 | |
200-299K | 95 | 4910 | 17399 | |
300-399K | 382 | 6456 | 14646 | |
400-499K | 206 | 4290 | 8912 | |
500K+ | 681 | 6087 | 16684 | |
Total Working Age Population | 11,113 | 140,288 | 324,926 | |
In Work Force | 8,495 | 109,363 | 238,352 | |
Not In Work Force | 2,618 | 30,926 | 86,574 | |
Workforce Employed | 8,320 | 104,640 | 228,087 | |
Workforce Unemployed | 163 | 4,593 | 10,044 | |
Civlian Workforce | 8,482 | 109,233 | 238,131 | |
Military Workforce | 13 | 130 | 221 | |
Total Households | 6,869 | 81,733 | 167,280 | |
Family Households | 2,668 | 38,976 | 95,365 | |
Non-Family Households | 4,201 | 42,758 | 71,916 | |
Married Couple | 2,091 | 27,846 | 69,990 | |
Other Family | 578 | 11,130 | 25,375 | |
Married w/Child | 388 | 10,817 | 28,790 | |
Single Male w/Child | 25 | 1,458 | 2,931 | |
Single Female w/Child | 250 | 4,856 | 10,859 |
Population Change Last Two Decades - Plus Projection
2000 | % | 2010 | % | 2020 | % | 2030 | |
---|---|---|---|---|---|---|---|
Texas | 20,851,820 | +21 | 25,145,561 | +18 | 29,677,668 | +18 | 34,894,452 |
Denton County | 432,976 | +53 | 662,614 | +36 | 897,953 | +37 | 1,234,110 |
Collin County | 491,675 | +59 | 782,341 | +33 | 1,039,369 | +34 | 1,391,461 |
Dallas County | 2,218,899 | +7 | 2,368,139 | +15 | 2,734,111 | +14 | 3,106,298 |
Total Working Age Population:
Total Households:
Total Working Age Population:
Total Households:
Total Working Age Population:
Total Households: