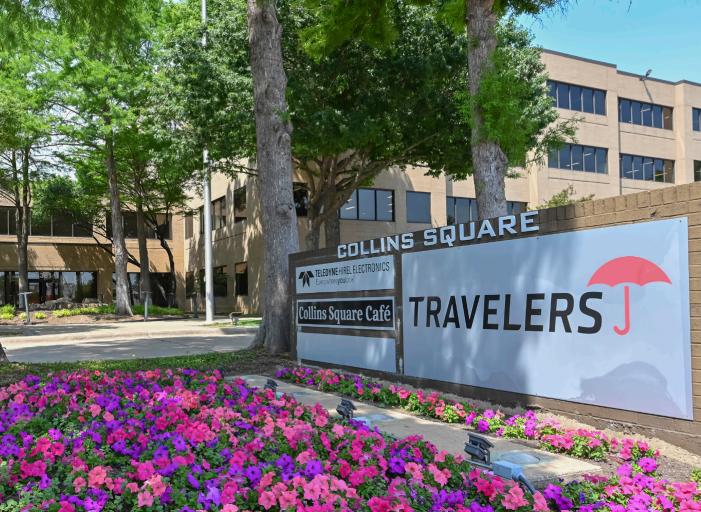
1-Mile | 3-Miles | 5-Miles | ||
---|---|---|---|---|
Total Population | 7,736 | 114,754 | 371,485 | |
Population Median Age | 40 | 38 | 36 | |
Population by Age | 0-9 Yrs | 886 (11%) | 13680 (11%) | 51264 (13%) |
10-19 Yrs | 534 (6%) | 13322 (11%) | 47170 (12%) | |
20-29 Yrs | 1323 (17%) | 19181 (16%) | 60989 (16%) | |
30-39 Yrs | 1347 (17%) | 17189 (14%) | 56000 (15%) | |
40-49 Yrs | 711 (9%) | 12669 (11%) | 45692 (12%) | |
50-59 Yrs | 1146 (14%) | 14539 (12%) | 45064 (12%) | |
60-69 Yrs | 1091 (14%) | 12728 (11%) | 34482 (9%) | |
70+ Yrs | 697 (9%) | 11448 (9%) | 30825 (8%) | |
Median HH Income | $94,136 | $76,112 | $64,247 | |
Total Household Income | < 24K | 143 (4%) | 5181 (11%) | 21575 (16%) |
25-49K | 417 (12%) | 8150 (18%) | 30519 (22%) | |
50-74K | 638 (19%) | 8382 (19%) | 24844 (18%) | |
75-99K | 549 (16%) | 5718 (13%) | 16768 (12%) | |
100-199K | 1208 (37%) | 12557 (28%) | 30393 (22%) | |
200K+ | 282 (8%) | 3947 (8%) | 10594 (7%) | |
Highest Education Level | No Diploma | 295 | 7470 | 36245 |
Diploma or GED | 794 | 11418 | 43022 | |
Some College | 1140 | 17094 | 49796 | |
Assoc. Degree | 562 | 6494 | 17355 | |
Bachelors Degree | 2008 | 22975 | 61105 | |
Higher Degree | 1055 | 13524 | 35719 | |
Total Housing Units | 3,576 | 46,439 | 145,221 | |
--Owner-Occupied | 2,002 | 25,161 | 65,401 | |
--Renter-Occupied | 1,236 | 18,773 | 69,291 | |
Owner-Occupied Values | < 100K | 11 | 770 | 3689 |
100-199K | 395 | 6894 | 18326 | |
200-299K | 1176 | 9050 | 19792 | |
300-399K | 307 | 4934 | 13072 | |
400-499K | 75 | 1856 | 5903 | |
500K+ | 38 | 1656 | 4618 | |
Total Working Age Population | 6,551 | 93,147 | 292,530 | |
In Work Force | 4,904 | 64,327 | 203,948 | |
Not In Work Force | 1,647 | 28,821 | 88,583 | |
Workforce Employed | 4,744 | 61,466 | 193,225 | |
Workforce Unemployed | 160 | 2,804 | 10,634 | |
Civlian Workforce | 4,904 | 64,271 | 203,859 | |
Military Workforce | 0 | 56 | 88 | |
Total Households | 3,238 | 43,934 | 134,693 | |
Family Households | 2,111 | 28,784 | 87,584 | |
Non-Family Households | 1,127 | 15,150 | 47,109 | |
Married Couple | 1,631 | 21,314 | 61,676 | |
Other Family | 480 | 7,469 | 25,909 | |
Married w/Child | 462 | 8,428 | 26,994 | |
Single Male w/Child | 29 | 895 | 3,921 | |
Single Female w/Child | 245 | 2,638 | 9,391 |
Population Change Last Two Decades - Plus Projection
2000 | % | 2010 | % | 2020 | % | 2030 | |
---|---|---|---|---|---|---|---|
Texas | 20,851,820 | +21 | 25,145,561 | +18 | 29,677,668 | +18 | 34,894,452 |
Collin County | 491,675 | +59 | 782,341 | +33 | 1,039,369 | +34 | 1,391,461 |
Dallas County | 2,218,899 | +7 | 2,368,139 | +15 | 2,734,111 | +14 | 3,106,298 |
Total Working Age Population:
Total Households:
Total Working Age Population:
Total Households:
Total Working Age Population:
Total Households: