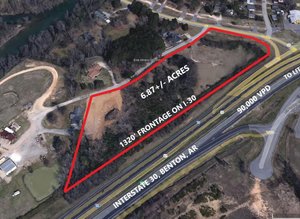
1-Mile | 3-Miles | 5-Miles | ||
---|---|---|---|---|
Total Population | 6,446 | 63,898 | 134,983 | |
Population Median Age | 37 | 39 | 38 | |
Population by Age | 0-9 Yrs | 982 (15%) | 7986 (12%) | 16934 (12%) |
10-19 Yrs | 675 (10%) | 7134 (11%) | 15837 (11%) | |
20-29 Yrs | 1015 (15%) | 10800 (16%) | 21300 (15%) | |
30-39 Yrs | 810 (12%) | 8552 (13%) | 18818 (13%) | |
40-49 Yrs | 898 (13%) | 7852 (12%) | 16513 (12%) | |
50-59 Yrs | 738 (11%) | 6985 (10%) | 16279 (12%) | |
60-69 Yrs | 786 (12%) | 7658 (11%) | 15982 (11%) | |
70+ Yrs | 540 (8%) | 6931 (10%) | 13320 (9%) | |
Median HH Income | $34,294 | $51,902 | $55,871 | |
Total Household Income | < 24K | 1099 (38%) | 6815 (24%) | 12377 (21%) |
25-49K | 672 (23%) | 7029 (24%) | 14241 (24%) | |
50-74K | 458 (16%) | 4457 (15%) | 9829 (16%) | |
75-99K | 200 (7%) | 3093 (10%) | 6463 (11%) | |
100-199K | 371 (13%) | 5362 (18%) | 10836 (18%) | |
200K+ | 51 (1%) | 1607 (5%) | 4334 (7%) | |
Highest Education Level | No Diploma | 651 | 2764 | 5803 |
Diploma or GED | 972 | 8868 | 19054 | |
Some College | 770 | 9449 | 19052 | |
Assoc. Degree | 278 | 3033 | 5780 | |
Bachelors Degree | 854 | 11984 | 25017 | |
Higher Degree | 908 | 8066 | 18301 | |
Total Housing Units | 3,210 | 31,965 | 65,437 | |
--Owner-Occupied | 1,358 | 15,751 | 33,192 | |
--Renter-Occupied | 1,493 | 12,611 | 24,888 | |
Owner-Occupied Values | < 100K | 225 | 2561 | 6380 |
100-199K | 1034 | 7937 | 12370 | |
200-299K | 73 | 3184 | 6543 | |
300-399K | 20 | 1248 | 3676 | |
400-499K | 0 | 465 | 1709 | |
500K+ | 6 | 356 | 2513 | |
Total Working Age Population | 4,982 | 51,171 | 108,100 | |
In Work Force | 3,013 | 33,540 | 71,633 | |
Not In Work Force | 1,969 | 17,632 | 36,467 | |
Workforce Employed | 2,899 | 32,273 | 68,859 | |
Workforce Unemployed | 114 | 1,165 | 2,583 | |
Civlian Workforce | 3,013 | 33,438 | 71,442 | |
Military Workforce | 0 | 102 | 191 | |
Total Households | 2,851 | 28,362 | 58,080 | |
Family Households | 1,554 | 15,121 | 31,952 | |
Non-Family Households | 1,298 | 13,242 | 26,128 | |
Married Couple | 734 | 9,680 | 20,907 | |
Other Family | 820 | 5,441 | 11,045 | |
Married w/Child | 296 | 3,456 | 7,461 | |
Single Male w/Child | 74 | 451 | 1,048 | |
Single Female w/Child | 455 | 2,836 | 5,150 |
Population Change Last Two Decades - Plus Projection
2000 | % | 2010 | % | 2020 | % | 2030 | |
---|---|---|---|---|---|---|---|
Arkansas | 2,673,400 | +9 | 2,915,918 | +5 | 3,072,430 | +6 | 3,271,344 |
Pulaski County | 361,474 | +6 | 382,748 | +7 | 409,626 | +7 | 438,011 |
Total Working Age Population:
Total Households:
Total Working Age Population:
Total Households:
Total Working Age Population:
Total Households: