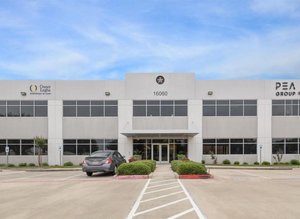
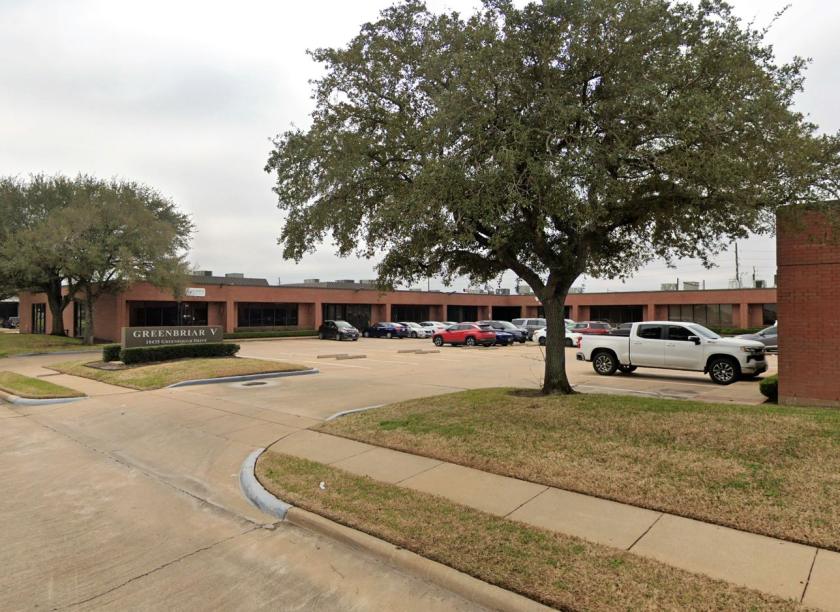
1-Mile | 3-Miles | 5-Miles | ||
---|---|---|---|---|
Total Population | 7,504 | 92,060 | 343,819 | |
Population Median Age | 36 | 38 | 37 | |
Population by Age | 0-9 Yrs | 991 (13%) | 11037 (11%) | 46445 (13%) |
10-19 Yrs | 971 (12%) | 11779 (12%) | 46916 (13%) | |
20-29 Yrs | 1207 (16%) | 13619 (14%) | 50153 (14%) | |
30-39 Yrs | 1117 (14%) | 12537 (13%) | 48021 (13%) | |
40-49 Yrs | 963 (12%) | 11821 (12%) | 43828 (12%) | |
50-59 Yrs | 980 (13%) | 12486 (13%) | 43680 (12%) | |
60-69 Yrs | 932 (12%) | 11475 (12%) | 39098 (11%) | |
70+ Yrs | 344 (4%) | 7307 (7%) | 25678 (7%) | |
Median HH Income | $55,287 | $66,063 | $57,937 | |
Total Household Income | < 24K | 529 (18%) | 4822 (14%) | 24092 (20%) |
25-49K | 758 (26%) | 7589 (23%) | 28701 (23%) | |
50-74K | 538 (19%) | 5838 (18%) | 21773 (18%) | |
75-99K | 444 (15%) | 4234 (13%) | 13898 (11%) | |
100-199K | 534 (18%) | 7705 (23%) | 24024 (20%) | |
200K+ | 23 (0%) | 2113 (6%) | 7524 (6%) | |
Highest Education Level | No Diploma | 835 | 8560 | 39250 |
Diploma or GED | 995 | 13684 | 53411 | |
Some College | 897 | 11673 | 43452 | |
Assoc. Degree | 459 | 4532 | 15920 | |
Bachelors Degree | 1352 | 16608 | 48213 | |
Higher Degree | 392 | 7448 | 25925 | |
Total Housing Units | 3,009 | 33,923 | 130,487 | |
--Owner-Occupied | 1,089 | 19,365 | 62,100 | |
--Renter-Occupied | 1,737 | 12,935 | 57,912 | |
Owner-Occupied Values | < 100K | 185 | 2243 | 7281 |
100-199K | 341 | 7988 | 26160 | |
200-299K | 423 | 5401 | 15288 | |
300-399K | 93 | 2540 | 7898 | |
400-499K | 36 | 571 | 2274 | |
500K+ | 11 | 621 | 3198 | |
Total Working Age Population | 5,931 | 73,847 | 268,494 | |
In Work Force | 4,290 | 50,176 | 178,222 | |
Not In Work Force | 1,642 | 23,671 | 90,272 | |
Workforce Employed | 4,034 | 47,151 | 165,563 | |
Workforce Unemployed | 256 | 3,026 | 12,496 | |
Civlian Workforce | 4,290 | 50,176 | 178,059 | |
Military Workforce | 0 | 0 | 163 | |
Total Households | 2,826 | 32,300 | 120,012 | |
Family Households | 2,057 | 23,619 | 84,284 | |
Non-Family Households | 769 | 8,681 | 35,728 | |
Married Couple | 1,143 | 15,800 | 54,128 | |
Other Family | 914 | 7,819 | 30,156 | |
Married w/Child | 424 | 6,064 | 22,951 | |
Single Male w/Child | 27 | 632 | 3,155 | |
Single Female w/Child | 454 | 3,076 | 11,627 |
Population Change Last Two Decades - Plus Projection
2000 | % | 2010 | % | 2020 | % | 2030 | |
---|---|---|---|---|---|---|---|
Texas | 20,851,820 | +21 | 25,145,561 | +18 | 29,677,668 | +18 | 34,894,452 |
Fort Bend County | 354,452 | +65 | 585,375 | +44 | 840,383 | +43 | 1,203,029 |
Harris County | 3,400,578 | +20 | 4,092,459 | +22 | 4,978,845 | +19 | 5,924,750 |
Total Working Age Population:
Total Households:
Total Working Age Population:
Total Households:
Total Working Age Population:
Total Households: