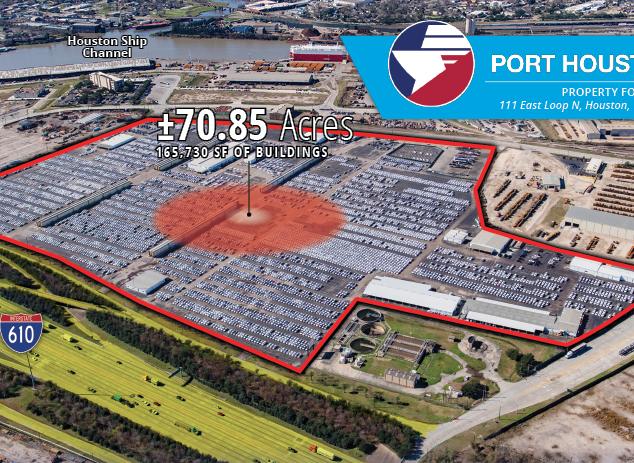
Commercial Land
111 East Loop Freeway Houston, TX 77029
111 East Loop Freeway Houston, TX 77029
Details & Description
Property Highlights
- • Water and Sewer by the Port Authority
- • Extensive Electrical Distribution
- • Overhead Cranes
- • Preferential Berth Access
- • Rail service with PTRA
- • ±1,000 feet to Deepwater Dock
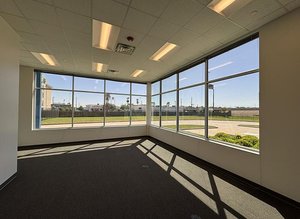
Additional Photos


Listing Agents

Mike Taetz
O: 713-830-2107
M: 713-446-6777
mike.taetz@colliers.com
O: 713-830-2107
M: 713-446-6777
mike.taetz@colliers.com
While we strive to provide the most accurate information, all listing information, and demographic data, is provided by third-parties. As such, MyEListing will not be responsible for the accuracy of the information. It is strongly recommended that you verify all information with the listing agent, and any relevant agencies, prior to making any decisions.