Office Space
2880 Broadway Bend Drive- Building 2 Pearland, TX 77584
2880 Broadway Bend Drive- Building 2 Pearland, TX 77584
Details & Description
Property Highlights
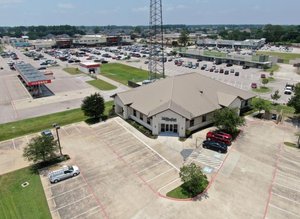
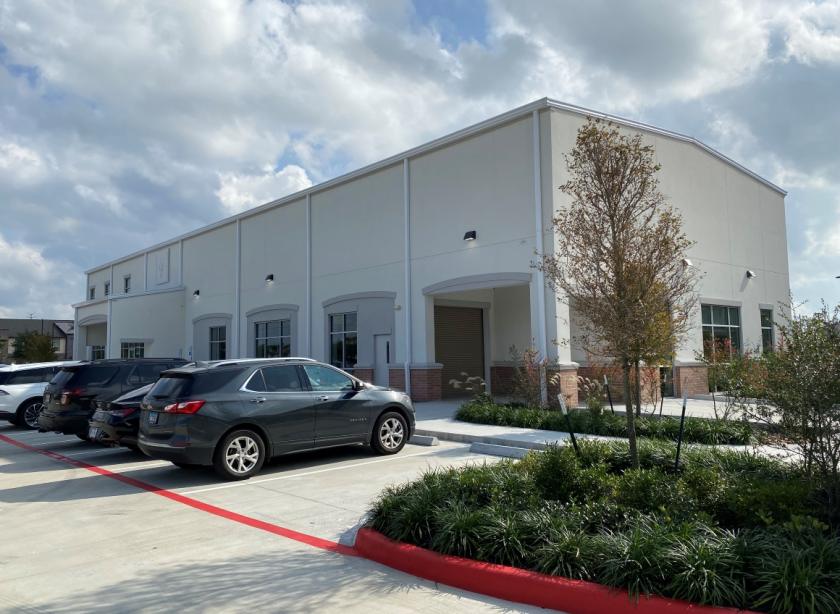
• Owner-User Opportunity: 9,378 SF, single-story, class A office building, situated on ±1.0 acres
• 5 minutes from 20+ dining options, the Pearland Town Center, and Shadow Creek Ranch Shopping Center
Listing Agents

Todd Moore
O: 713-830-2191
M: 832-725-1567
todd.moore@colliers.com
O: 713-830-2191
M: 832-725-1567
todd.moore@colliers.com

Connor Duffy
O: 713-830-4010
M: 727-482-4448
connor.duffy@colliers.com
O: 713-830-4010
M: 727-482-4448
connor.duffy@colliers.com

Ray Lopez
O: 713-830-2116
M: 713-853-6753
ray.lopez@colliers.com
O: 713-830-2116
M: 713-853-6753
ray.lopez@colliers.com
While we strive to provide the most accurate information, all listing information, and demographic data, is provided by third-parties. As such, MyEListing will not be responsible for the accuracy of the information. It is strongly recommended that you verify all information with the listing agent, and any relevant agencies, prior to making any decisions.