Commercial Land
1001 S Auburn St Colfax, CA 95713
1001 S Auburn St Colfax, CA 95713

Details & Description
Property Highlights
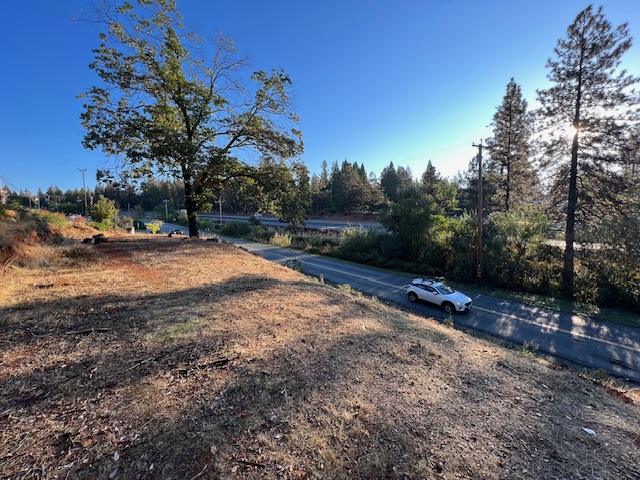
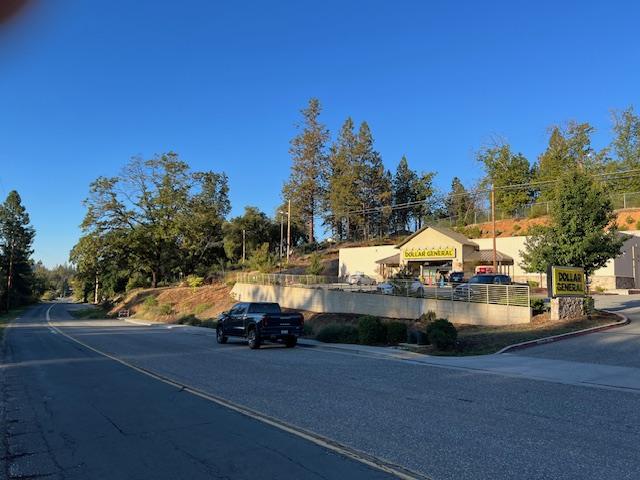
- • Close to 40,000 vehicles pass the site daily.
- • Ready for retail development.
- • City utilities available.
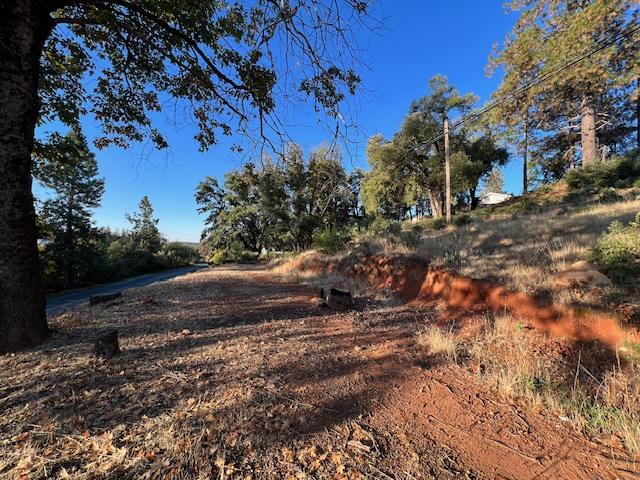
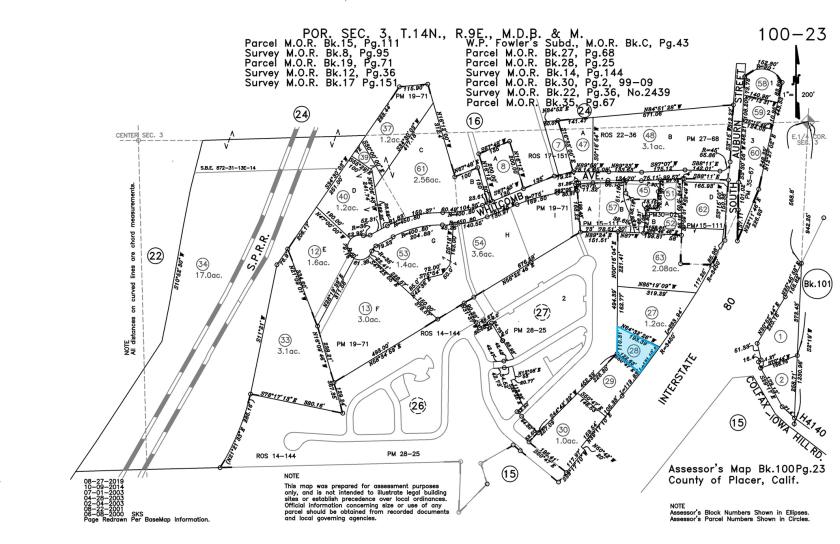
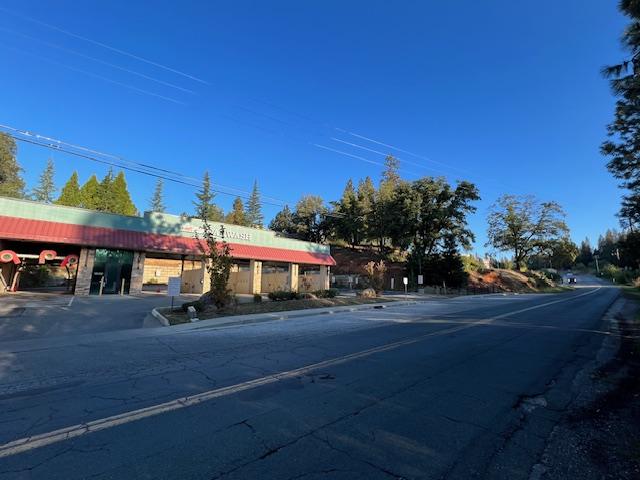
Additional Photos


Listing Agents

Lock Richards
O: 530-470-1740
lock@highlandcre.com
O: 530-470-1740
lock@highlandcre.com
While we strive to provide the most accurate information, all listing information, and demographic data, is provided by third-parties. As such, MyEListing will not be responsible for the accuracy of the information. It is strongly recommended that you verify all information with the listing agent, and any relevant agencies, prior to making any decisions.