Office Space
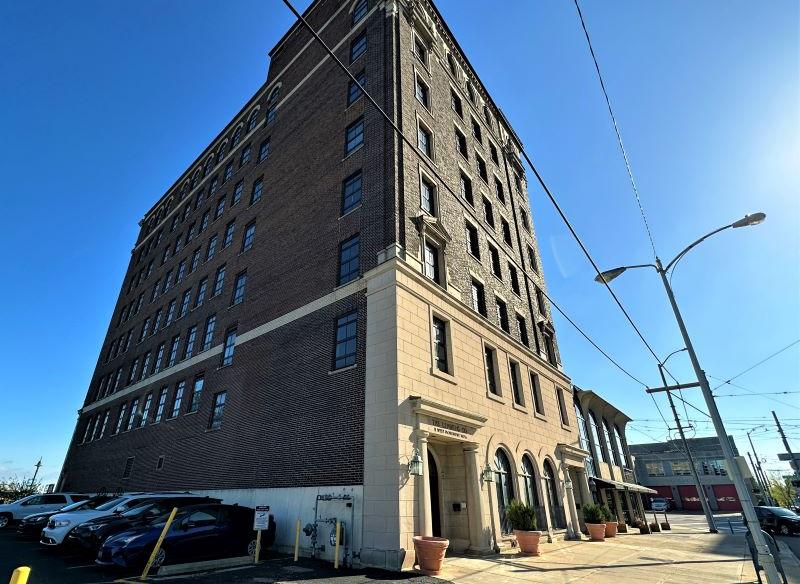
11 West Monument Avenue Dayton, OH 45402
11 West Monument Avenue Dayton, OH 45402
Details & Description
Property Highlights
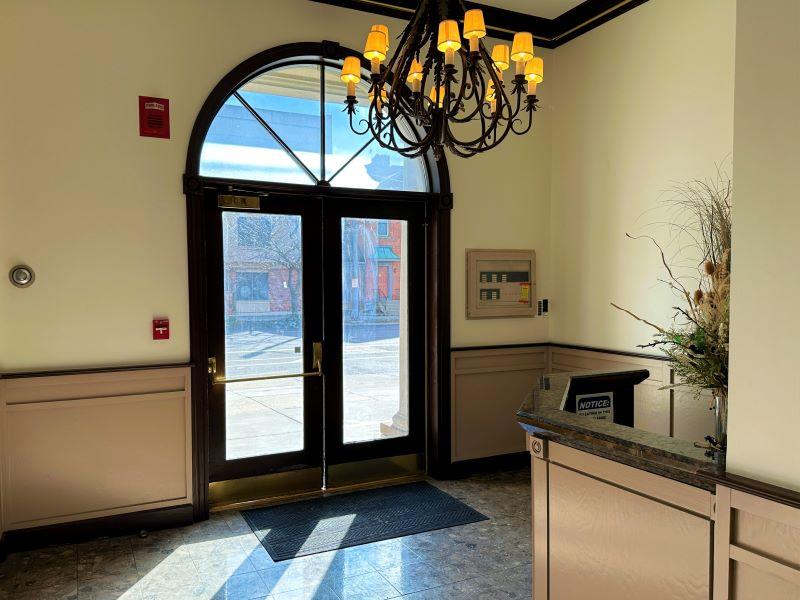
- • Classic architecture and premium finishes.
- • Assortment of suite sizes available.
- • Close to many downtown amenities.
- • Street parking and surface lot available nearby.
Listing Agents

Timothy Albro
O: 937-222-1600
M: 937-609-8071
talbro@crestrealtyohio.com
O: 937-222-1600
M: 937-609-8071
talbro@crestrealtyohio.com
While we strive to provide the most accurate information, all listing information, and demographic data, is provided by third-parties. As such, MyEListing will not be responsible for the accuracy of the information. It is strongly recommended that you verify all information with the listing agent, and any relevant agencies, prior to making any decisions.